• Metric Reports for Web
  • Dashboard for Web

    Show / Hide Table of Contents
    • Web Dashboard - Designer Mode
      • Creating a Dashboard
      • Providing Data
        • Create a New Data Source
        • Connect to an Existing Data Source
        • Dashboard Data Source Wizard
          • Specify Data Source Settings (Database)
          • Specify Data Source Settings (JSON)
          • Specify Data Source Settings (OLAP)
        • Query Builder
        • Preview Data
        • Manage Data Sources
        • Working with SQL Data Sources
          • Manage SQL Queries
          • Filter Queries
          • Pass Query Parameters
          • Stored Procedures
        • Filter Data Sources
        • Calculated Fields
        • Data Inspector
      • Adding Dashboard Items
      • Binding Dashboard Items to Data
        • Binding Dashboard Items to Data in the Web Dashboard
        • Hidden Data Items
        • Binding Dashboard Items to Data in OLAP Mode
      • Designing Dashboard Items
        • Chart
          • Providing Data
          • Series
          • Panes
          • Interactivity
          • Legend
          • Axes
          • Orientation
        • Scatter Chart
          • Providing Data
          • Interactivity
          • Legend
          • Axes
          • Orientation
          • Labels
        • Grid
          • Providing Data
          • Columns
          • Interactivity
          • Conditional Formatting
          • Totals
          • Layout
        • Pies
          • Providing Data
          • Interactivity
          • Layout
          • Labels
          • Style
        • Cards
          • Providing Data
          • Layout
          • Delta
          • Sparkline
          • Formatting
          • Interactivity
          • Cards Arrangement
          • Conditional Formatting
        • Gauges
          • Providing Data
          • Delta
          • Gauge Scale
          • Interactivity
          • Layout
          • Style
        • Pivot
          • Providing Data
          • Interactivity
          • Conditional Formatting
          • Layout
          • Expanded State
        • Choropleth Map
          • Providing Maps
          • Providing Data
          • Delta
          • Map Navigation
          • Interactivity
          • Labels
          • Legend
        • Geo Point Maps
          • Map Types Overview
          • Providing Maps
          • Geo Point Map
            • Providing Data
          • Bubble Map
            • Providing Data
            • Legends
          • Pie Map
            • Providing Data
            • Pie Options
            • Coloring
            • Legends
          • Clustering
          • Map Navigation
          • Interactivity
          • Labels
        • Range Filter
          • Providing Data
          • Series
          • Interactivity
          • Predefined Periods
        • Date Filter
        • Images
          • Image Overview
          • Providing Images
          • Interactivity
          • Image Settings
        • Text Box
        • Treemap
          • Providing Data
          • Interactivity
          • Layout
          • Grouping
          • Coloring
          • Labels
        • Filter Elements
          • Filter Elements Overview
          • Providing Data
          • Interactivity
        • Dashboard Item Group
        • Tab Container
      • Data Shaping
        • Summarization
        • Grouping
        • Sorting
        • Filtering
        • Top N
        • Formatting Data
      • Interactivity
        • Master Filtering
        • Drill-Down
        • Neutral Filter Mode
      • Appearance Customization
        • Conditional Formatting
        • Coloring
        • Themes
      • Data Analysis
        • Aggregations
        • Calculations
        • Dashboard Parameters
          • Creating Parameters
          • Passing Parameter Values
          • Requesting Parameter Values
        • Expression Constants, Operators, and Functions
      • Converting Dashboard Items
      • Dashboard Layout
        • Dashboard Title
        • Dashboard Item Caption
        • Dashboard Items Layout
      • Undo and Redo Operations
      • Saving a Dashboard
      • Opening a Dashboard
      • Exporting
      • UI Elements
        • Toolbox
        • Dashboard Surface
        • Dashboard Menu
        • Dashboard Item Menu
        • Data Item Menu
    • Web Dashboard - Viewer Mode
      • Data Presentation
        • Data Presentation Basics
        • Master Filtering
        • Drill-Down
        • Dashboard Layout
      • Mobile Layout
      • Dashboard Parameters
        • Requesting Parameter Values
      • Exporting
      • Dashboard Items
        • Chart
          • Data Presentation Basics
          • Interactivity
          • Exporting
        • Scatter Chart
          • Data Presentation Basics
          • Interactivity
          • Exporting
        • Grid
          • Data Presentation Basics
          • Interactivity
          • Exporting
        • Pies
          • Data Presentation Basics
          • Interactivity
          • Exporting
        • Cards
          • Data Presentation Basics
          • Interactivity
          • Exporting
        • Gauges
          • Data Presentation Basics
          • Interactivity
          • Exporting
        • Pivot
          • Exporting
        • Choropleth Map
          • Data Presentation Basics
          • Interactivity
          • Exporting
        • Geo Point Maps
          • Data Presentation Basics
          • Interactivity
          • Exporting
        • Range Filter
          • Exporting
        • Image
          • Exporting
        • Text Box
          • Exporting
        • Treemap
          • Data Presentation Basics
          • Interactivity
          • Exporting
        • Filter Elements
        • Tab Container

    Coloring

    The Web Dashboard provides the capability to manage the coloring of dashboard item elements, such as chart series points or pie segments.

    • Supported Dashboard Items
    • Color Schemes Overview
    • Coloring Measures and Dimensions
    • Customizing Color Palettes Using the Dashboard Item Menu
    • Customizing Color Palettes Using the Color Scheme Page

    Supported Dashboard Items

    You can manage coloring for the following dashboard items.

    • Chart
    • Scatter Chart
    • Pie
    • Pie Map
    • Range Filter
    • Treemap

    Color Schemes Overview

    The dashboard provides two ways of coloring dashboard item elements.

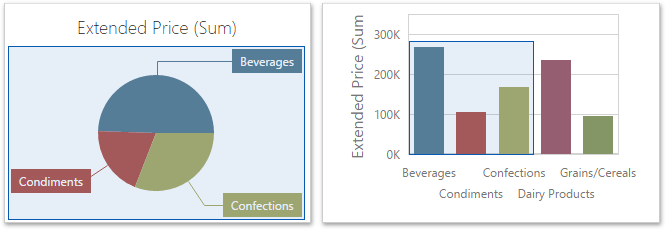
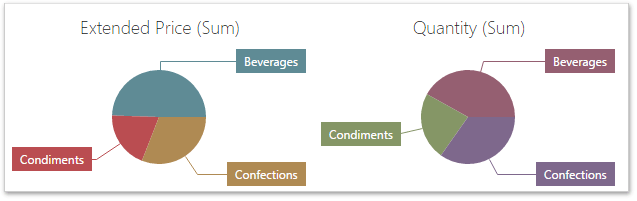
    • Global color scheme. This color scheme provides consistent colors for identical values across the dashboard. The image below shows the dashboard containing Pie and Chart dashboard items. Pie segments and chart series points corresponding to Beverages, Condiments and Confections dimension values are colored using identical colors from the default palette.

      wdd-coloring-global-scheme

      Important

      When a global color scheme is used, the dashboard reserves automatically generated colors for certain values regardless of the filter state.

    • Local color scheme. This color scheme provides an independent set of colors for each dashboard item.

      Important

      When a local color scheme is used, the dashboard reassigns palette colors when the filter state is changed.

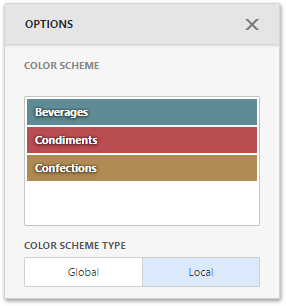
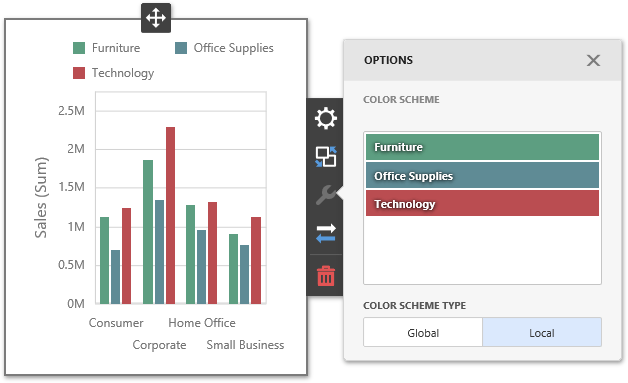
    To select a type of coloring dashboard item elements, open the dashboard item menu, go to the Color Scheme section and use the Color Scheme Type option.

    wdd-coloring-change-color-scheme

    Coloring Measures and Dimensions

    Dashboard items allow you to manage the coloring of individual dimensions or all dashboard item measures using predefined coloring modes.

    The following coloring settings are available.

    Setting Description
    Auto Dimension values/measures are colored by default. To learn how specific dashboard items color their elements by default, see the Coloring topic for the corresponding dashboard item.
    On Dimension values/measures are colored by different hues.
    Off Dimension values/measures are colored with the same color.

    You can configure coloring in two ways.

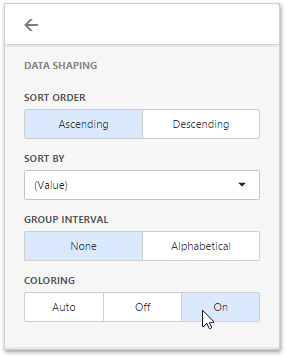
    • To specify the coloring mode for the specific measure/dimension, open the data item menu and go to Data Shaping section. Use the Coloring option to specify coloring mode of this data item.

      wdd-coloring-data-item-options

    • To see a list of all measures/dimensions for which you can specify coloring mode, open the dashboard item's Options menu and go to the Coloring section.

      wdd-coloring-options

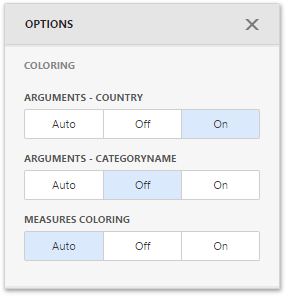
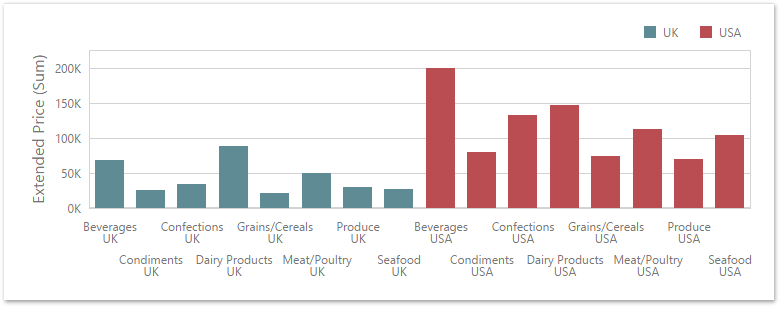
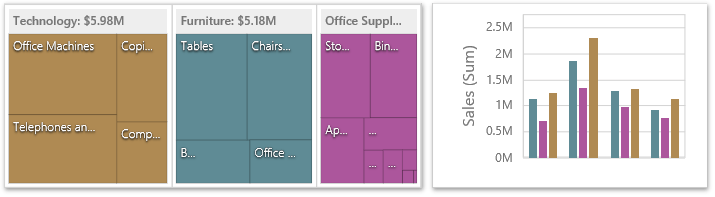
    For example, the image below shows the Chart dashboard item whose Country dimension is colored by different hues...

    wdd-coloring-color-by-measure

    ...and this image shows the Pie dashboard item whose measures are colored by different hues.

    wdd-coloring-by-measure

    Note

    If you enabled coloring by different hues for several dimensions/measures, all combinations of dimension values/measures will be automatically colored using different colors from the default palette.

    Customizing Color Palettes Using the Dashboard Item Menu

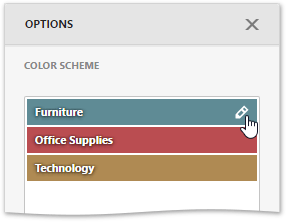
    The Web Dashboard allows you to customize colors of the specific palette using the Color Scheme section of the dashboard item Options menu. To edit the color scheme, click the Edit button (the wdd-icon-edit-collection-value-item icon) of the corresponding color.

    wdd-coloring-change-dashboard-item-color-scheme

    Then, pick any color using the RGB color model in the invoked color picker and click Confirm to change the color.

    wdd-coloring-color-picker

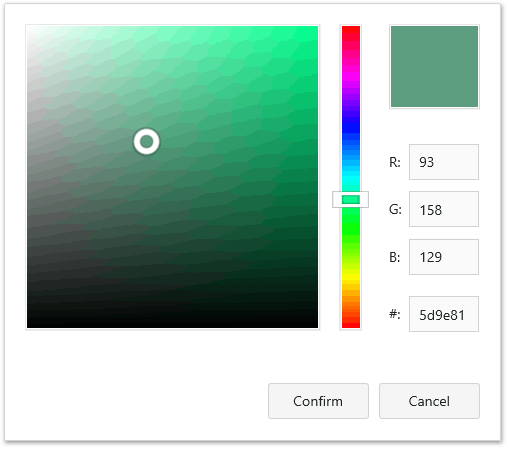
    A new color scheme will be applied to the dashboard item(s).

    wdd-coloring-change-local-scheme

    Customizing Color Palettes Using the Color Schemes Page

    The Color Scheme page of the dashboard menu allows you to customize color tables by editing and adding colors.

    wdd-coloring-scheme-page

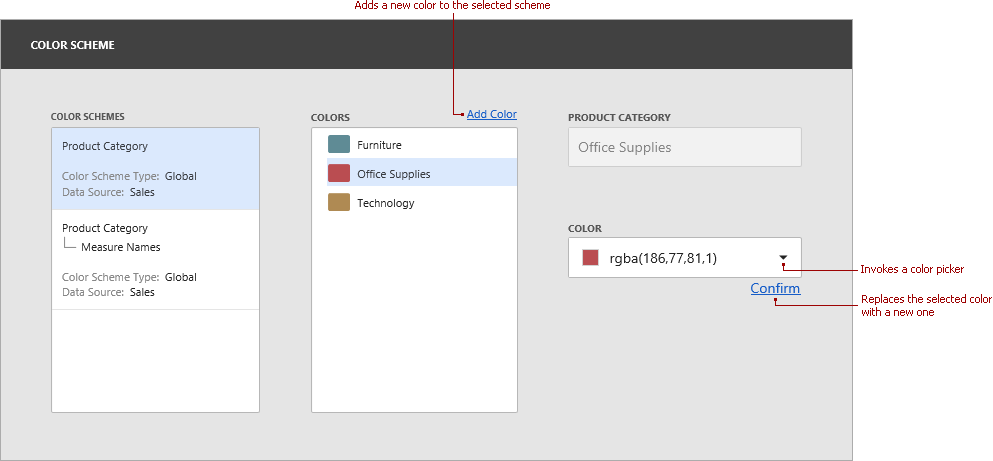
    • Edit colors. You can reassign a color in the selected color table. For this, select one of the available schemes in the Color Schemes pane and click the required color in the Colors pane to provide access to the Color combo box.

      Clicking the Color dropdown button invokes a color picker where you can specify a new color.

      wdd-coloring-invoke-color-picker

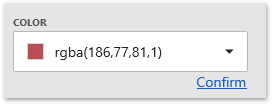
      Click Confirm to change the automatically assigned color for the selected value and update the current color scheme.

      wdd-coloring-changed-color

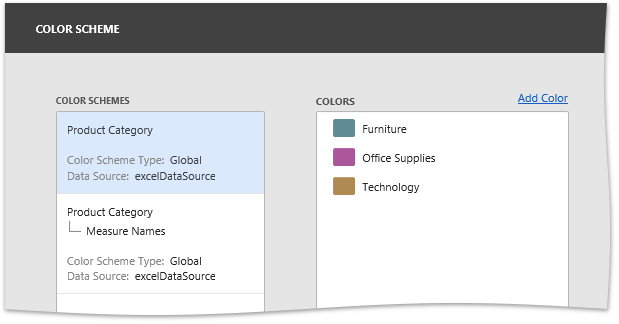
      The image below demonstrates the dashboard items that are colored using the updated color table.

      wdd-coloring-new-scheme

    • Add colors. The Color Scheme page allows you to add a new value with the specified color to the selected color scheme. To do this, use the Add color button.

      wdd-coloring-adding-color

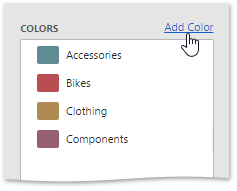
      Specify the dimension value of the added color or select the required measures. This creates a new value whose color can be specified as described in the Edit colors section.

      wdd-coloring-added-color

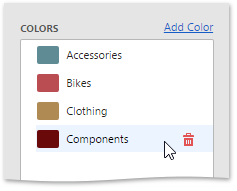
      You can remove manually added values using the Remove button (the wdd-icon-delete-big icon).

    Back to top Copyright © 2020 Metric d.o.o. www.mymetric.net, metric@zg.t-com.hr