• Metric Reports for Web
  • Dashboard for Web

    Show / Hide Table of Contents
    • Web Dashboard - Designer Mode
      • Creating a Dashboard
      • Providing Data
        • Create a New Data Source
        • Connect to an Existing Data Source
        • Dashboard Data Source Wizard
          • Specify Data Source Settings (Database)
          • Specify Data Source Settings (JSON)
          • Specify Data Source Settings (OLAP)
        • Query Builder
        • Preview Data
        • Manage Data Sources
        • Working with SQL Data Sources
          • Manage SQL Queries
          • Filter Queries
          • Pass Query Parameters
          • Stored Procedures
        • Filter Data Sources
        • Calculated Fields
        • Data Inspector
      • Adding Dashboard Items
      • Binding Dashboard Items to Data
        • Binding Dashboard Items to Data in the Web Dashboard
        • Hidden Data Items
        • Binding Dashboard Items to Data in OLAP Mode
      • Designing Dashboard Items
        • Chart
          • Providing Data
          • Series
          • Panes
          • Interactivity
          • Legend
          • Axes
          • Orientation
        • Scatter Chart
          • Providing Data
          • Interactivity
          • Legend
          • Axes
          • Orientation
          • Labels
        • Grid
          • Providing Data
          • Columns
          • Interactivity
          • Conditional Formatting
          • Totals
          • Layout
        • Pies
          • Providing Data
          • Interactivity
          • Layout
          • Labels
          • Style
        • Cards
          • Providing Data
          • Layout
          • Delta
          • Sparkline
          • Formatting
          • Interactivity
          • Cards Arrangement
          • Conditional Formatting
        • Gauges
          • Providing Data
          • Delta
          • Gauge Scale
          • Interactivity
          • Layout
          • Style
        • Pivot
          • Providing Data
          • Interactivity
          • Conditional Formatting
          • Layout
          • Expanded State
        • Choropleth Map
          • Providing Maps
          • Providing Data
          • Delta
          • Map Navigation
          • Interactivity
          • Labels
          • Legend
        • Geo Point Maps
          • Map Types Overview
          • Providing Maps
          • Geo Point Map
            • Providing Data
          • Bubble Map
            • Providing Data
            • Legends
          • Pie Map
            • Providing Data
            • Pie Options
            • Coloring
            • Legends
          • Clustering
          • Map Navigation
          • Interactivity
          • Labels
        • Range Filter
          • Providing Data
          • Series
          • Interactivity
          • Predefined Periods
        • Date Filter
        • Images
          • Image Overview
          • Providing Images
          • Interactivity
          • Image Settings
        • Text Box
        • Treemap
          • Providing Data
          • Interactivity
          • Layout
          • Grouping
          • Coloring
          • Labels
        • Filter Elements
          • Filter Elements Overview
          • Providing Data
          • Interactivity
        • Dashboard Item Group
        • Tab Container
      • Data Shaping
        • Summarization
        • Grouping
        • Sorting
        • Filtering
        • Top N
        • Formatting Data
      • Interactivity
        • Master Filtering
        • Drill-Down
        • Neutral Filter Mode
      • Appearance Customization
        • Conditional Formatting
        • Coloring
        • Themes
      • Data Analysis
        • Aggregations
        • Calculations
        • Dashboard Parameters
          • Creating Parameters
          • Passing Parameter Values
          • Requesting Parameter Values
        • Expression Constants, Operators, and Functions
      • Converting Dashboard Items
      • Dashboard Layout
        • Dashboard Title
        • Dashboard Item Caption
        • Dashboard Items Layout
      • Undo and Redo Operations
      • Saving a Dashboard
      • Opening a Dashboard
      • Exporting
      • UI Elements
        • Toolbox
        • Dashboard Surface
        • Dashboard Menu
        • Dashboard Item Menu
        • Data Item Menu
    • Web Dashboard - Viewer Mode
      • Data Presentation
        • Data Presentation Basics
        • Master Filtering
        • Drill-Down
        • Dashboard Layout
      • Mobile Layout
      • Dashboard Parameters
        • Requesting Parameter Values
      • Exporting
      • Dashboard Items
        • Chart
          • Data Presentation Basics
          • Interactivity
          • Exporting
        • Scatter Chart
          • Data Presentation Basics
          • Interactivity
          • Exporting
        • Grid
          • Data Presentation Basics
          • Interactivity
          • Exporting
        • Pies
          • Data Presentation Basics
          • Interactivity
          • Exporting
        • Cards
          • Data Presentation Basics
          • Interactivity
          • Exporting
        • Gauges
          • Data Presentation Basics
          • Interactivity
          • Exporting
        • Pivot
          • Exporting
        • Choropleth Map
          • Data Presentation Basics
          • Interactivity
          • Exporting
        • Geo Point Maps
          • Data Presentation Basics
          • Interactivity
          • Exporting
        • Range Filter
          • Exporting
        • Image
          • Exporting
        • Text Box
          • Exporting
        • Treemap
          • Data Presentation Basics
          • Interactivity
          • Exporting
        • Filter Elements
        • Tab Container

    Layout

    The Card dashboard item allows you to manage the position and visibility of elements displayed on cards. These elements include actual and target values, a delta indicator and corresponding delta values, a sparkline, etc.

    To manage the position and visibility of card elements, choose a predefined layout template and customize its settings.

    • Available Layout Templates
    • Default Layout
    • Change Layout

    Available Layout Templates

    The table below contains information about the available layout templates:

    Layout Type Example Description
    Stretched Card_StretchedLayout_Web 
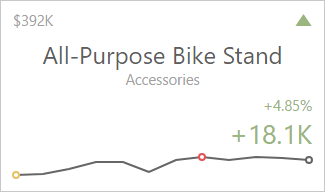
The Stretched layout template arranges card elements so that they occupy an entire card area.
    Centered Card_CenteredLayout_Web 
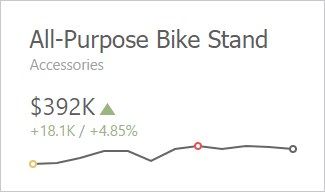
The Centered layout template is used to center card elements so that they occupy a specified width/height.
    Compact Card_CompactLayout_Web 
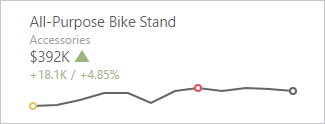
The Compact layout template is used to arrange card elements so that they occupy the minimum area.
    Lightweight Card_LightweightLayout_Web The Lightweight layout template displays the minimum set of elements within a card.

    For all layout types, you can change the visibility of its elements, or you can specify the display value type for data-bound elements. To learn more, see the Change Layout paragraph below.

    Default Layout

    The Card dashboard item uses the Stretched layout template that arranges card visual elements in the following way by default:

    Card_StretchedLayout_Web_AllElements

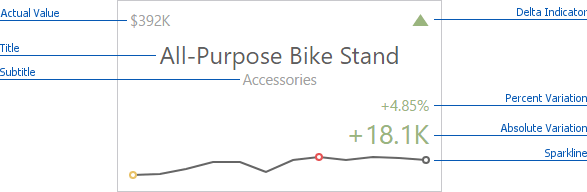
    To learn more about the available value types and visual elements, see Change Layout.

    Note

    Delta Indicator and delta values (such as Percent Variation or Absolute Variation) are colored depending on delta settings. To learn how to manage delta settings, see Delta.

    Change Layout

    To change a card's layout in the Web Dashboard's UI, invoke the Binding menu, click the required data item in the Cards section and go to Cards Layout in the data item's menu. Select the required layout type and click the Edit button (the wdd-icon-edit-collection-value-item icon) to change its settings. The following settings are available:

    • Min width - Specifies the minimum width of the card content.
    • Max width - Allows you to specify the maximum width of the card content. Select the Auto option to determine the maximum width automatically or switch to Custom and specify the required width manually.

    You can show/hide the following values and visual elements within the card:

    Value Description Example
    Title Displays values of the last (bottommost) dimension placed in the Series section. Microsoft Office Keyboard
    Subtitle Displays combined values of all dimensions except the last (bottommost) dimension. Technology - Computer Peripherals
    Absolute Variation An absolute difference between the actual and target value (see Delta). +18.1K
    Actual Value A summary value for a measure placed in the Actual placeholder. $392K
    Card Name A card name. Revenue vs. Target
    Percent of Target A percent of a target value (see Delta). 104.85 %
    Percent Variation A percent difference between the actual and target value (see Delta). 4.85 %
    Target Value A summary value for a measure placed in the Target placeholder. $374K
    Dimension {Name} Allows you to display values of a specific dimension placed in the Series section. Technology
    Element Description Example
    Delta Indicator Indicates whether the actual value is less or greater than the target value (see Delta). Card_DeltaIndicatorExample_Web
    Sparkline Visualizes the variation of actual or target values. To learn more, see Sparkline. Card_SparklineExample_Web

    Use the Apply to All Cards button to propagate the specified layout settings to all cards corresponding to Actual-Target pairs. The Reset button resets all setting to their default values.

    Back to top Copyright © 2020 Metric d.o.o. www.mymetric.net, metric@zg.t-com.hr