• Metric Reports for Web
  • Dashboard for Web

    Show / Hide Table of Contents
    • Web Dashboard - Designer Mode
      • Creating a Dashboard
      • Providing Data
        • Create a New Data Source
        • Connect to an Existing Data Source
        • Dashboard Data Source Wizard
          • Specify Data Source Settings (Database)
          • Specify Data Source Settings (JSON)
          • Specify Data Source Settings (OLAP)
        • Query Builder
        • Preview Data
        • Manage Data Sources
        • Working with SQL Data Sources
          • Manage SQL Queries
          • Filter Queries
          • Pass Query Parameters
          • Stored Procedures
        • Filter Data Sources
        • Calculated Fields
        • Data Inspector
      • Adding Dashboard Items
      • Binding Dashboard Items to Data
        • Binding Dashboard Items to Data in the Web Dashboard
        • Hidden Data Items
        • Binding Dashboard Items to Data in OLAP Mode
      • Designing Dashboard Items
        • Chart
          • Providing Data
          • Series
          • Panes
          • Interactivity
          • Legend
          • Axes
          • Orientation
        • Scatter Chart
          • Providing Data
          • Interactivity
          • Legend
          • Axes
          • Orientation
          • Labels
        • Grid
          • Providing Data
          • Columns
          • Interactivity
          • Conditional Formatting
          • Totals
          • Layout
        • Pies
          • Providing Data
          • Interactivity
          • Layout
          • Labels
          • Style
        • Cards
          • Providing Data
          • Layout
          • Delta
          • Sparkline
          • Formatting
          • Interactivity
          • Cards Arrangement
          • Conditional Formatting
        • Gauges
          • Providing Data
          • Delta
          • Gauge Scale
          • Interactivity
          • Layout
          • Style
        • Pivot
          • Providing Data
          • Interactivity
          • Conditional Formatting
          • Layout
          • Expanded State
        • Choropleth Map
          • Providing Maps
          • Providing Data
          • Delta
          • Map Navigation
          • Interactivity
          • Labels
          • Legend
        • Geo Point Maps
          • Map Types Overview
          • Providing Maps
          • Geo Point Map
            • Providing Data
          • Bubble Map
            • Providing Data
            • Legends
          • Pie Map
            • Providing Data
            • Pie Options
            • Coloring
            • Legends
          • Clustering
          • Map Navigation
          • Interactivity
          • Labels
        • Range Filter
          • Providing Data
          • Series
          • Interactivity
          • Predefined Periods
        • Date Filter
        • Images
          • Image Overview
          • Providing Images
          • Interactivity
          • Image Settings
        • Text Box
        • Treemap
          • Providing Data
          • Interactivity
          • Layout
          • Grouping
          • Coloring
          • Labels
        • Filter Elements
          • Filter Elements Overview
          • Providing Data
          • Interactivity
        • Dashboard Item Group
        • Tab Container
      • Data Shaping
        • Summarization
        • Grouping
        • Sorting
        • Filtering
        • Top N
        • Formatting Data
      • Interactivity
        • Master Filtering
        • Drill-Down
        • Neutral Filter Mode
      • Appearance Customization
        • Conditional Formatting
        • Coloring
        • Themes
      • Data Analysis
        • Aggregations
        • Calculations
        • Dashboard Parameters
          • Creating Parameters
          • Passing Parameter Values
          • Requesting Parameter Values
        • Expression Constants, Operators, and Functions
      • Converting Dashboard Items
      • Dashboard Layout
        • Dashboard Title
        • Dashboard Item Caption
        • Dashboard Items Layout
      • Undo and Redo Operations
      • Saving a Dashboard
      • Opening a Dashboard
      • Exporting
      • UI Elements
        • Toolbox
        • Dashboard Surface
        • Dashboard Menu
        • Dashboard Item Menu
        • Data Item Menu
    • Web Dashboard - Viewer Mode
      • Data Presentation
        • Data Presentation Basics
        • Master Filtering
        • Drill-Down
        • Dashboard Layout
      • Mobile Layout
      • Dashboard Parameters
        • Requesting Parameter Values
      • Exporting
      • Dashboard Items
        • Chart
          • Data Presentation Basics
          • Interactivity
          • Exporting
        • Scatter Chart
          • Data Presentation Basics
          • Interactivity
          • Exporting
        • Grid
          • Data Presentation Basics
          • Interactivity
          • Exporting
        • Pies
          • Data Presentation Basics
          • Interactivity
          • Exporting
        • Cards
          • Data Presentation Basics
          • Interactivity
          • Exporting
        • Gauges
          • Data Presentation Basics
          • Interactivity
          • Exporting
        • Pivot
          • Exporting
        • Choropleth Map
          • Data Presentation Basics
          • Interactivity
          • Exporting
        • Geo Point Maps
          • Data Presentation Basics
          • Interactivity
          • Exporting
        • Range Filter
          • Exporting
        • Image
          • Exporting
        • Text Box
          • Exporting
        • Treemap
          • Data Presentation Basics
          • Interactivity
          • Exporting
        • Filter Elements
        • Tab Container

    Passing Parameter Values

    In this topic, it describes how to pass the created dashboard parameter to the dashboard. For instance, you can include a dashboard parameter to a WHERE clause of the SQL query or you can filter a dashboard dynamically according to the required parameter value(s).

    The created dashboard parameter can be used in the following scenarios:

    • SQL Queries
    • Filtering
    • Conditional Formatting
    • Calculated Fields
    • Window Calculations

    SQL Queries

    The Web Dashboard provides the capability to bind a dashboard parameter and the existing SQL query/stored procedure parameter. This can be useful when you need to filter the SQL query dynamically by including the parameter value in the WHERE clause.

    wdd-configure-query-param-page2

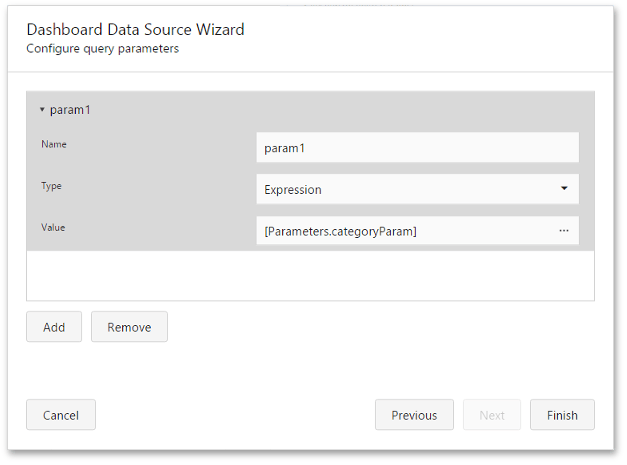
    To bind a dashboard parameter to an SQL query/stored procedure parameter in the Dashboard Data Source Wizard, do the following:

    • Select the existing query/stored procedure parameter or create a new query parameter using the Add button.
    • Set the Expression as a parameter value and click the ellipsis button to invoke the Expression Editor for this parameter.
    • In the Expression Editor add the required dashboard parameter from the Parameters column.

    Filtering

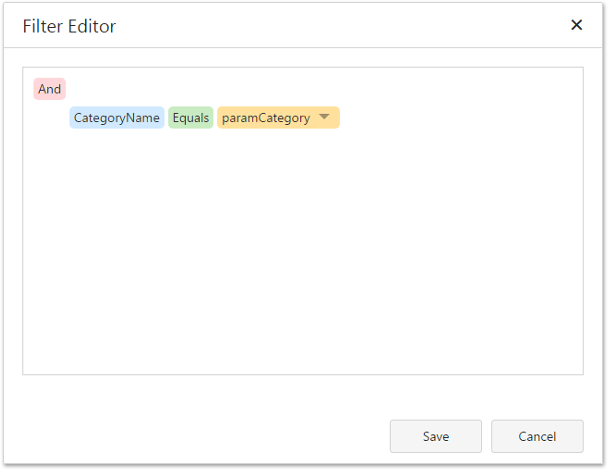
    You can filter the specified query of the SQL Data Source, the entire Excel Data Source/Object Data Source or apply filtering to a specific dashboard item according to the current parameter value(s) using the Filter Editor.

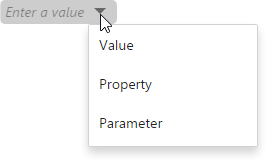
    In the Filter Editor, you can compare a field value with different objects such as static values, values of another field or parameter values. To switch between values, click a down arrow glyph in the operand value placeholder to expand the list of available objects. Select the Parameter object to compare a field value with a parameter value.

    wdd-filter-editor-change-object

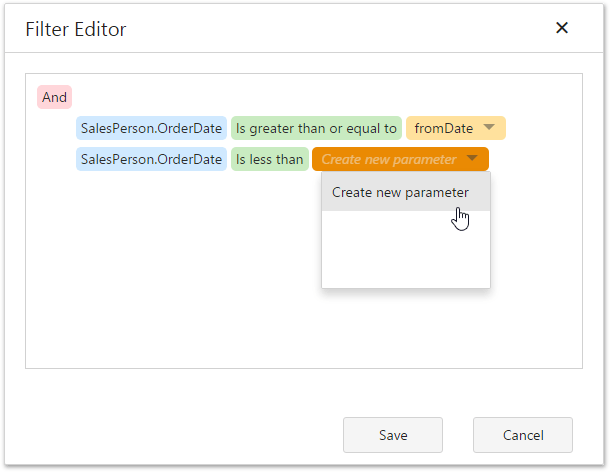
    Then, click the operand value to invoke the list of available parameters and select the existing parameter or create a new one.

    wdd-parameters-filtering

    Conditional Formatting

    You can apply conditional formatting to a specific dashboard item according to the current parameter value when creating the Expression format condition. Use this capability to format dashboard item elements dynamically, depending on the current parameter value.

    wdd-parameters-conditional-formatting

    To switch between values, click the down arrow glyph in the operand value placeholder to expand the list of available objects and select the Parameter object to create a format rule with a parameter.

    Calculated Fields

    You can use parameters when constructing expressions for calculated fields. This allows you to evaluate values of the calculated field dynamically depending on the current parameter value.

    wdd-parameters-calculated-field

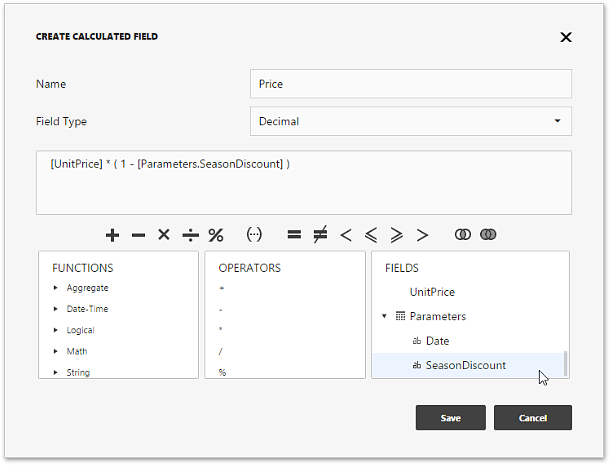
    To include a parameter in the expression, double-click the required parameter in the Fields pane.

    Window Calculations

    You can use parameters when customizing expressions for window calculations. This allows you to apply a calculation dynamically, depending on the current parameter value.

    wdd-parameters-window-calculations

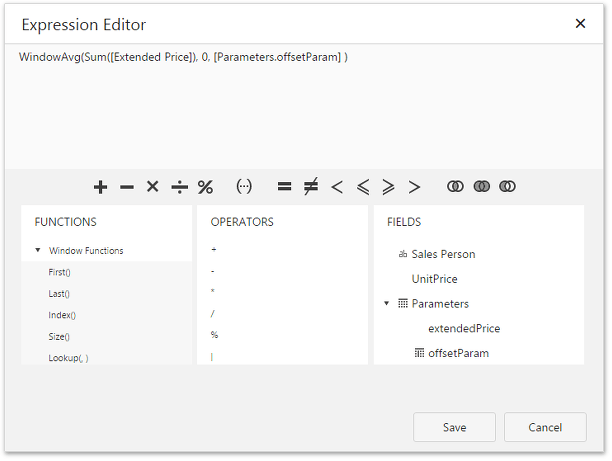
    To create the calculation with a parameter, select the Custom calculation and click Edit. In the invoked Expression Editor double-click the required parameter.

    Back to top Copyright © 2020 Metric d.o.o. www.mymetric.net, metric@zg.t-com.hr