• Metric Reports for Web
  • Dashboard for Web

    Show / Hide Table of Contents
    • Web Dashboard - Designer Mode
      • Creating a Dashboard
      • Providing Data
        • Create a New Data Source
        • Connect to an Existing Data Source
        • Dashboard Data Source Wizard
          • Specify Data Source Settings (Database)
          • Specify Data Source Settings (JSON)
          • Specify Data Source Settings (OLAP)
        • Query Builder
        • Preview Data
        • Manage Data Sources
        • Working with SQL Data Sources
          • Manage SQL Queries
          • Filter Queries
          • Pass Query Parameters
          • Stored Procedures
        • Filter Data Sources
        • Calculated Fields
        • Data Inspector
      • Adding Dashboard Items
      • Binding Dashboard Items to Data
        • Binding Dashboard Items to Data in the Web Dashboard
        • Hidden Data Items
        • Binding Dashboard Items to Data in OLAP Mode
      • Designing Dashboard Items
        • Chart
          • Providing Data
          • Series
          • Panes
          • Interactivity
          • Legend
          • Axes
          • Orientation
        • Scatter Chart
          • Providing Data
          • Interactivity
          • Legend
          • Axes
          • Orientation
          • Labels
        • Grid
          • Providing Data
          • Columns
          • Interactivity
          • Conditional Formatting
          • Totals
          • Layout
        • Pies
          • Providing Data
          • Interactivity
          • Layout
          • Labels
          • Style
        • Cards
          • Providing Data
          • Layout
          • Delta
          • Sparkline
          • Formatting
          • Interactivity
          • Cards Arrangement
          • Conditional Formatting
        • Gauges
          • Providing Data
          • Delta
          • Gauge Scale
          • Interactivity
          • Layout
          • Style
        • Pivot
          • Providing Data
          • Interactivity
          • Conditional Formatting
          • Layout
          • Expanded State
        • Choropleth Map
          • Providing Maps
          • Providing Data
          • Delta
          • Map Navigation
          • Interactivity
          • Labels
          • Legend
        • Geo Point Maps
          • Map Types Overview
          • Providing Maps
          • Geo Point Map
            • Providing Data
          • Bubble Map
            • Providing Data
            • Legends
          • Pie Map
            • Providing Data
            • Pie Options
            • Coloring
            • Legends
          • Clustering
          • Map Navigation
          • Interactivity
          • Labels
        • Range Filter
          • Providing Data
          • Series
          • Interactivity
          • Predefined Periods
        • Date Filter
        • Images
          • Image Overview
          • Providing Images
          • Interactivity
          • Image Settings
        • Text Box
        • Treemap
          • Providing Data
          • Interactivity
          • Layout
          • Grouping
          • Coloring
          • Labels
        • Filter Elements
          • Filter Elements Overview
          • Providing Data
          • Interactivity
        • Dashboard Item Group
        • Tab Container
      • Data Shaping
        • Summarization
        • Grouping
        • Sorting
        • Filtering
        • Top N
        • Formatting Data
      • Interactivity
        • Master Filtering
        • Drill-Down
        • Neutral Filter Mode
      • Appearance Customization
        • Conditional Formatting
        • Coloring
        • Themes
      • Data Analysis
        • Aggregations
        • Calculations
        • Dashboard Parameters
          • Creating Parameters
          • Passing Parameter Values
          • Requesting Parameter Values
        • Expression Constants, Operators, and Functions
      • Converting Dashboard Items
      • Dashboard Layout
        • Dashboard Title
        • Dashboard Item Caption
        • Dashboard Items Layout
      • Undo and Redo Operations
      • Saving a Dashboard
      • Opening a Dashboard
      • Exporting
      • UI Elements
        • Toolbox
        • Dashboard Surface
        • Dashboard Menu
        • Dashboard Item Menu
        • Data Item Menu
    • Web Dashboard - Viewer Mode
      • Data Presentation
        • Data Presentation Basics
        • Master Filtering
        • Drill-Down
        • Dashboard Layout
      • Mobile Layout
      • Dashboard Parameters
        • Requesting Parameter Values
      • Exporting
      • Dashboard Items
        • Chart
          • Data Presentation Basics
          • Interactivity
          • Exporting
        • Scatter Chart
          • Data Presentation Basics
          • Interactivity
          • Exporting
        • Grid
          • Data Presentation Basics
          • Interactivity
          • Exporting
        • Pies
          • Data Presentation Basics
          • Interactivity
          • Exporting
        • Cards
          • Data Presentation Basics
          • Interactivity
          • Exporting
        • Gauges
          • Data Presentation Basics
          • Interactivity
          • Exporting
        • Pivot
          • Exporting
        • Choropleth Map
          • Data Presentation Basics
          • Interactivity
          • Exporting
        • Geo Point Maps
          • Data Presentation Basics
          • Interactivity
          • Exporting
        • Range Filter
          • Exporting
        • Image
          • Exporting
        • Text Box
          • Exporting
        • Treemap
          • Data Presentation Basics
          • Interactivity
          • Exporting
        • Filter Elements
        • Tab Container

    Specify Data Source Settings (Database)

    The following pages are available for the Database source type:

    Select a Data Connection

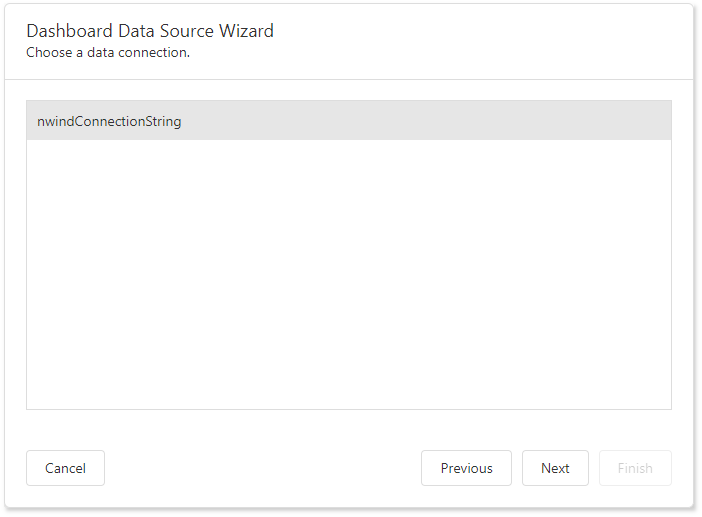
    The "Choose a data connection" page appears if you select Database on the start page. Select an existing connection from the list.

    Choose Queries

    The next page allows you to create/edit a query or select a stored procedure. The image below displays a generated query displayed in the SQL string editor.

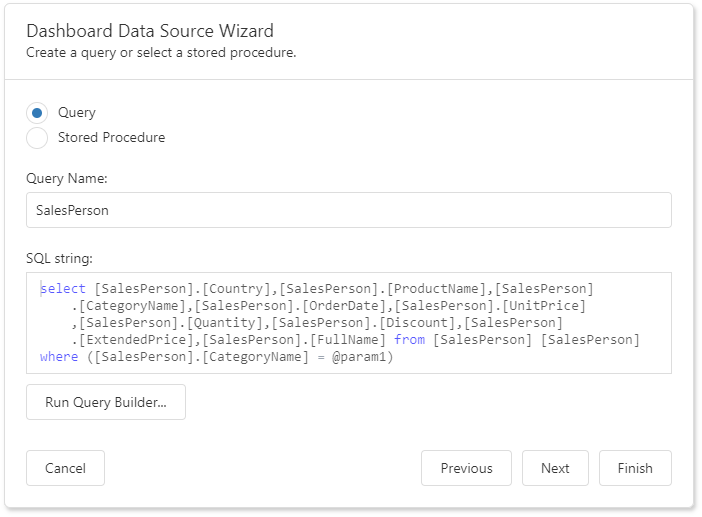
    Click Run Query Builder... to launch the Query Builder and choose the tables/columns visually.

    Configure Query Parameters

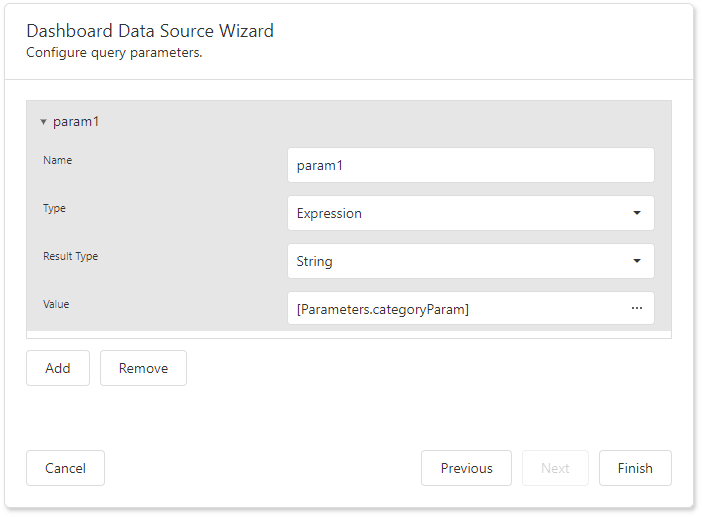
    If the SQL query contains query parameters, click Next to configure them.

    You can use the following approaches to specify a parameter value:

    • Assign a static value

      Select a query parameter's type from the Type drop-down list and specify a value based on the selected type.

    • Provide a dynamic parameter value

      Set the Type option to Expression and specify the Result Type. Click the Value option's ellipsis button and construct an expression in the invoked Expression Editor.

    Click Finish to create a new data source.

    Back to top Copyright © 2020 Metric d.o.o. www.mymetric.net, metric@zg.t-com.hr