Predefined Periods
The Range Filter dashboard item allows you to add a number of predefined date-time periods that can be used to perform a selection (for instance, year-to-date or quarter-to-date).
Add Predefined Ranges
To add predefined ranges, open the Range Filter's Options menu and go to the Custom Periods section. Click "+" to add a new period.
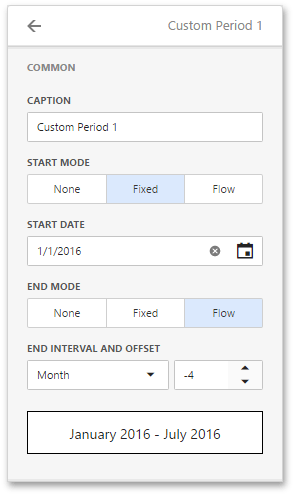
You can specify the following settings for the start/end boundaries.
- Caption - Specifies a predefined period caption.
- Start Mode - Specifies a mode of the start boundary.
- End Mode - Specifies a mode of the end boundary.
The following modes used to set predefined ranges are available.
- None - The selection will begin from the start/end of the visible range.
- Fixed - Allows you to select a specific date value using the calendar. Use the Start/End Date option to set a value.
Flow - Allows you to select a relative date value. The Interval option specifies the interval between the current date and the required date. The Offset option allows you to set the number of such intervals.
Note
Note that the Offset option can accept negative and positive values. Negative values correspond to dates before the current date, while positive values correspond to future dates.
Below you can find some examples of how to set up custom periods:
Fixed custom periods
2018
Start Point
- Mode: Fixed
- Start Date: 01/01/2018
End Point
- Mode: Fixed
- End Date: 12/31/2018
Q1 2017
Start Point
- Mode: Fixed
- Start Date: 01/01/2017
End Point
- Mode: Fixed
- End Date: 03/31/2018
Flow custom periods
6 Months
Start Point
- Mode: Flow
- Interval: Month
- Offset: -5
End Point
- Mode: None
Year to date
Start Point
- Mode: Flow
- Interval: Year
- Offset: 0
End Point
- Mode: Flow
- Interval: Day
- Offset: 0
Last Month
Start Point
- Mode: Flow
- Interval: Month
- Offset: -1
End Point
- Mode: Flow
- Interval: Month
- Offset: 0
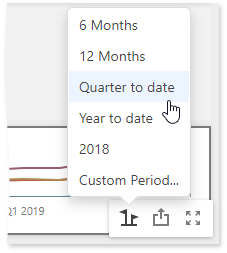
Select Predefined Ranges
To select a predefined period, click the Select Date Time Period button (the  icon) in the Range Filter's caption and select the required period from the list.