• Metric Reports for Web
  • Dashboard for Web

    Show / Hide Table of Contents
    • Web Dashboard - Designer Mode
      • Creating a Dashboard
      • Providing Data
        • Create a New Data Source
        • Connect to an Existing Data Source
        • Dashboard Data Source Wizard
          • Specify Data Source Settings (Database)
          • Specify Data Source Settings (JSON)
          • Specify Data Source Settings (OLAP)
        • Query Builder
        • Preview Data
        • Manage Data Sources
        • Working with SQL Data Sources
          • Manage SQL Queries
          • Filter Queries
          • Pass Query Parameters
          • Stored Procedures
        • Filter Data Sources
        • Calculated Fields
        • Data Inspector
      • Adding Dashboard Items
      • Binding Dashboard Items to Data
        • Binding Dashboard Items to Data in the Web Dashboard
        • Hidden Data Items
        • Binding Dashboard Items to Data in OLAP Mode
      • Designing Dashboard Items
        • Chart
          • Providing Data
          • Series
          • Panes
          • Interactivity
          • Legend
          • Axes
          • Orientation
        • Scatter Chart
          • Providing Data
          • Interactivity
          • Legend
          • Axes
          • Orientation
          • Labels
        • Grid
          • Providing Data
          • Columns
          • Interactivity
          • Conditional Formatting
          • Totals
          • Layout
        • Pies
          • Providing Data
          • Interactivity
          • Layout
          • Labels
          • Style
        • Cards
          • Providing Data
          • Layout
          • Delta
          • Sparkline
          • Formatting
          • Interactivity
          • Cards Arrangement
          • Conditional Formatting
        • Gauges
          • Providing Data
          • Delta
          • Gauge Scale
          • Interactivity
          • Layout
          • Style
        • Pivot
          • Providing Data
          • Interactivity
          • Conditional Formatting
          • Layout
          • Expanded State
        • Choropleth Map
          • Providing Maps
          • Providing Data
          • Delta
          • Map Navigation
          • Interactivity
          • Labels
          • Legend
        • Geo Point Maps
          • Map Types Overview
          • Providing Maps
          • Geo Point Map
            • Providing Data
          • Bubble Map
            • Providing Data
            • Legends
          • Pie Map
            • Providing Data
            • Pie Options
            • Coloring
            • Legends
          • Clustering
          • Map Navigation
          • Interactivity
          • Labels
        • Range Filter
          • Providing Data
          • Series
          • Interactivity
          • Predefined Periods
        • Date Filter
        • Images
          • Image Overview
          • Providing Images
          • Interactivity
          • Image Settings
        • Text Box
        • Treemap
          • Providing Data
          • Interactivity
          • Layout
          • Grouping
          • Coloring
          • Labels
        • Filter Elements
          • Filter Elements Overview
          • Providing Data
          • Interactivity
        • Dashboard Item Group
        • Tab Container
      • Data Shaping
        • Summarization
        • Grouping
        • Sorting
        • Filtering
        • Top N
        • Formatting Data
      • Interactivity
        • Master Filtering
        • Drill-Down
        • Neutral Filter Mode
      • Appearance Customization
        • Conditional Formatting
        • Coloring
        • Themes
      • Data Analysis
        • Aggregations
        • Calculations
        • Dashboard Parameters
          • Creating Parameters
          • Passing Parameter Values
          • Requesting Parameter Values
        • Expression Constants, Operators, and Functions
      • Converting Dashboard Items
      • Dashboard Layout
        • Dashboard Title
        • Dashboard Item Caption
        • Dashboard Items Layout
      • Undo and Redo Operations
      • Saving a Dashboard
      • Opening a Dashboard
      • Exporting
      • UI Elements
        • Toolbox
        • Dashboard Surface
        • Dashboard Menu
        • Dashboard Item Menu
        • Data Item Menu
    • Web Dashboard - Viewer Mode
      • Data Presentation
        • Data Presentation Basics
        • Master Filtering
        • Drill-Down
        • Dashboard Layout
      • Mobile Layout
      • Dashboard Parameters
        • Requesting Parameter Values
      • Exporting
      • Dashboard Items
        • Chart
          • Data Presentation Basics
          • Interactivity
          • Exporting
        • Scatter Chart
          • Data Presentation Basics
          • Interactivity
          • Exporting
        • Grid
          • Data Presentation Basics
          • Interactivity
          • Exporting
        • Pies
          • Data Presentation Basics
          • Interactivity
          • Exporting
        • Cards
          • Data Presentation Basics
          • Interactivity
          • Exporting
        • Gauges
          • Data Presentation Basics
          • Interactivity
          • Exporting
        • Pivot
          • Exporting
        • Choropleth Map
          • Data Presentation Basics
          • Interactivity
          • Exporting
        • Geo Point Maps
          • Data Presentation Basics
          • Interactivity
          • Exporting
        • Range Filter
          • Exporting
        • Image
          • Exporting
        • Text Box
          • Exporting
        • Treemap
          • Data Presentation Basics
          • Interactivity
          • Exporting
        • Filter Elements
        • Tab Container

    Exporting

    The Web Dashboard allows you to export individual dashboard items or the entire dashboard. To learn more about exporting concepts common to all dashboard items, see the Exporting topic.

    This topic describes the specifics of exporting a Treemap dashboard item.

    • Export To PDF
    • Export To Image
    • Export To Excel

    Export To PDF

    The following options are available when exporting the Treemap dashboard item to a PDF.

    ExportToPdfDialog_ChartWeb

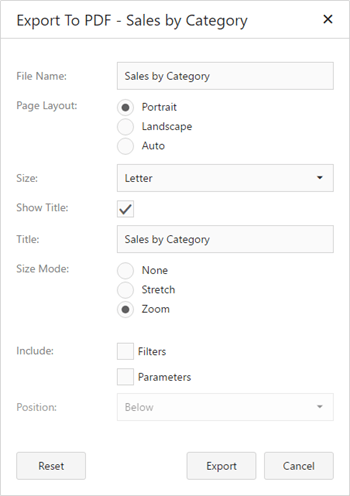
    • File Name - Specifies the name of the exported PDF.
    • Page Layout - Specifies the page orientation used to export a dashboard item.
    • Size - Specifies the standard paper size.
    • Show Title - Specifies whether or not to apply the dashboard item caption to the exported document title.
    • Title -Specifies the title of the exported document.
    • Size Mode - Specifies the export size mode for the Treemap dashboard item.
    • Include | Filters - Allows you to include master filter values to the exported document.
    • Include | Parameters - Allows you to include parameter values to the exported document.
    • Position - Specifies the position of the master filter and parameter values in the exported document. You can select between Below and Separate Page.

    Specify the required options in this dialog and click the Export button to export the Treemap dashboard item. To reset changes to the default values, click the Reset button.

    Export To Image

    All data-bound dashboard items provide the same set of options when exporting them to an Image format. The following options are available:

    ExportToImageDialog_ChartWeb

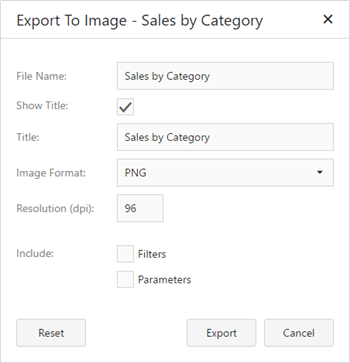
    • File Name - Specifies the name of the exported Image file.
    • Show Title - Specifies whether or not to apply the dashboard item caption to the exported document title.
    • Title - Specifies the title of the exported document.
    • Image Format - Specifies the image format in which the dashboard item is exported.
    • Resolution (dpi) - Specifies the resolution (in dpi) used to export a dashboard item.
    • Include | Filters - Allows you to include master filter values to the exported document.
    • Include | Parameters - Allows you to include parameter values to the exported document.

    Specify the required options in this dialog and click the Export button to export the dashboard item. To reset changes to the default values, click the Reset button.

    Export To Excel

    Data visualized within all data-bound dashboard items can be exported to the required Excel format. The following options are available:

    ExportToExcelDialog_Web

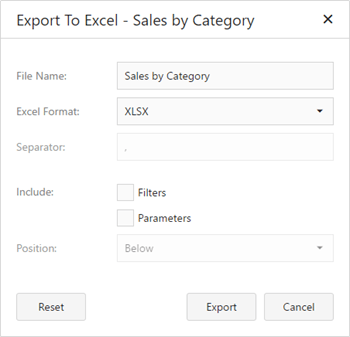
    • File Name - Specifies the name of the exported Excel file.
    • Excel Format - Specifies the Excel format in which the dashboard item is exported. You can use the XLSX, XLS or CSV formats.
    • Separator - Specifies the string used to separate values in the exported CSV document.
    • Include | Filters - Allows you to include master filter values to the exported document.
    • Include | Parameters - Allows you to include parameter values to the exported document.
    • Position - Specifies the position of the master filter and parameter values in the exported document. You can select between Below and Separate Sheet.

    Specify the required options in this dialog and click the Export button to export the dashboard item. To reset changes to the default values, click the Reset button.

    Back to top Copyright © 2020 Metric d.o.o. www.mymetric.net, metric@zg.t-com.hr