• Metric Reports for Web
  • Dashboard for Web

    Show / Hide Table of Contents
    • Web Dashboard - Designer Mode
      • Creating a Dashboard
      • Providing Data
        • Create a New Data Source
        • Connect to an Existing Data Source
        • Dashboard Data Source Wizard
          • Specify Data Source Settings (Database)
          • Specify Data Source Settings (JSON)
          • Specify Data Source Settings (OLAP)
        • Query Builder
        • Preview Data
        • Manage Data Sources
        • Working with SQL Data Sources
          • Manage SQL Queries
          • Filter Queries
          • Pass Query Parameters
          • Stored Procedures
        • Filter Data Sources
        • Calculated Fields
        • Data Inspector
      • Adding Dashboard Items
      • Binding Dashboard Items to Data
        • Binding Dashboard Items to Data in the Web Dashboard
        • Hidden Data Items
        • Binding Dashboard Items to Data in OLAP Mode
      • Designing Dashboard Items
        • Chart
          • Providing Data
          • Series
          • Panes
          • Interactivity
          • Legend
          • Axes
          • Orientation
        • Scatter Chart
          • Providing Data
          • Interactivity
          • Legend
          • Axes
          • Orientation
          • Labels
        • Grid
          • Providing Data
          • Columns
          • Interactivity
          • Conditional Formatting
          • Totals
          • Layout
        • Pies
          • Providing Data
          • Interactivity
          • Layout
          • Labels
          • Style
        • Cards
          • Providing Data
          • Layout
          • Delta
          • Sparkline
          • Formatting
          • Interactivity
          • Cards Arrangement
          • Conditional Formatting
        • Gauges
          • Providing Data
          • Delta
          • Gauge Scale
          • Interactivity
          • Layout
          • Style
        • Pivot
          • Providing Data
          • Interactivity
          • Conditional Formatting
          • Layout
          • Expanded State
        • Choropleth Map
          • Providing Maps
          • Providing Data
          • Delta
          • Map Navigation
          • Interactivity
          • Labels
          • Legend
        • Geo Point Maps
          • Map Types Overview
          • Providing Maps
          • Geo Point Map
            • Providing Data
          • Bubble Map
            • Providing Data
            • Legends
          • Pie Map
            • Providing Data
            • Pie Options
            • Coloring
            • Legends
          • Clustering
          • Map Navigation
          • Interactivity
          • Labels
        • Range Filter
          • Providing Data
          • Series
          • Interactivity
          • Predefined Periods
        • Date Filter
        • Images
          • Image Overview
          • Providing Images
          • Interactivity
          • Image Settings
        • Text Box
        • Treemap
          • Providing Data
          • Interactivity
          • Layout
          • Grouping
          • Coloring
          • Labels
        • Filter Elements
          • Filter Elements Overview
          • Providing Data
          • Interactivity
        • Dashboard Item Group
        • Tab Container
      • Data Shaping
        • Summarization
        • Grouping
        • Sorting
        • Filtering
        • Top N
        • Formatting Data
      • Interactivity
        • Master Filtering
        • Drill-Down
        • Neutral Filter Mode
      • Appearance Customization
        • Conditional Formatting
        • Coloring
        • Themes
      • Data Analysis
        • Aggregations
        • Calculations
        • Dashboard Parameters
          • Creating Parameters
          • Passing Parameter Values
          • Requesting Parameter Values
        • Expression Constants, Operators, and Functions
      • Converting Dashboard Items
      • Dashboard Layout
        • Dashboard Title
        • Dashboard Item Caption
        • Dashboard Items Layout
      • Undo and Redo Operations
      • Saving a Dashboard
      • Opening a Dashboard
      • Exporting
      • UI Elements
        • Toolbox
        • Dashboard Surface
        • Dashboard Menu
        • Dashboard Item Menu
        • Data Item Menu
    • Web Dashboard - Viewer Mode
      • Data Presentation
        • Data Presentation Basics
        • Master Filtering
        • Drill-Down
        • Dashboard Layout
      • Mobile Layout
      • Dashboard Parameters
        • Requesting Parameter Values
      • Exporting
      • Dashboard Items
        • Chart
          • Data Presentation Basics
          • Interactivity
          • Exporting
        • Scatter Chart
          • Data Presentation Basics
          • Interactivity
          • Exporting
        • Grid
          • Data Presentation Basics
          • Interactivity
          • Exporting
        • Pies
          • Data Presentation Basics
          • Interactivity
          • Exporting
        • Cards
          • Data Presentation Basics
          • Interactivity
          • Exporting
        • Gauges
          • Data Presentation Basics
          • Interactivity
          • Exporting
        • Pivot
          • Exporting
        • Choropleth Map
          • Data Presentation Basics
          • Interactivity
          • Exporting
        • Geo Point Maps
          • Data Presentation Basics
          • Interactivity
          • Exporting
        • Range Filter
          • Exporting
        • Image
          • Exporting
        • Text Box
          • Exporting
        • Treemap
          • Data Presentation Basics
          • Interactivity
          • Exporting
        • Filter Elements
        • Tab Container

    Grouping

    The Web Dashboard allows you to group dimension values and display summaries for entire groups rather than individual values. You can arrange dimension values in groups of different sizes by specifying the appropriate group interval. For instance, date-time values can be grouped by year, month, quarter, etc.

    Changing a Date-Time Group Interval

    Date-time values support the following group intervals.

    Note

    Examples in the table below are formatted with the default settings. To learn how to customize format settings, see the following help topic: Formatting Data.

    Group interval Description Examples
    Year Values are grouped by the year. 2010, 2011, 2012
    Quarter Values are grouped by the quarter. Q1, Q2, Q3, Q4
    Month Values are grouped by the month. January, February, March, ... December
    Day Values are grouped by the day of the month. 1, 2, 3, ... 31
    Hour Values are grouped by the hour. 0, 1, 2, ... 23
    Minute Values are grouped by the minute. 0, 1, 2, ... 59
    Second Values are grouped by the second. 0, 1, 2, ... 59
    Day of the Year Values are grouped by the day of the year. 1, 2, 3, ... 365
    Day of the Week Values are grouped by the day of the week. Sunday, Monday, Tuesday, ... Saturday
    Week of the Year Values are grouped by the week of the year. 1, 2, 3, ... 52
    Week of the Month Values are grouped by the week of the month. 1, 2, 3, 4, 5
    Week-Year Values are grouped by the date of the first day of the week (uses culture settings). 7/1/2018, 7/8/2018, 7/15/2018, ... 11/4/2018, 11/11/2018, 11/18/2018, ...
    Month-Year Values are grouped by the year and month. January 2012, February 2012, ... December 2012, January 2013, ...
    Quarter-Year Values are grouped by the year and quarter. Q3 2012, Q4 2012, Q1 2013, Q2 2013, ...
    Day-Month-Year Values are grouped by date. 3/4/2012, 3/5/2012, 3/6/2012, ...
    Date-Hour Values are grouped by date with the hour value. 3/4/2012 0:00 AM, 3/4/2012 1:00 AM, 3/4/2012 2:00 AM, ...
    Date-Hour-Minute Values are grouped by date with the hour and minute values. 3/4/2012 0:00 AM, 3/4/2012 0:01 AM, 3/4/2012 0:02 AM, ...
    Date-Hour-Minute-Second Values are grouped by date with the hour, minute and second values. 3/4/2012 0:00:00 AM, 3/4/2012 0:00:01 AM, 3/4/2012 0:00:02 AM, ...
    Exact Date Each value is displayed "as is". 2009, Q2 2009, 6/15/2009 1:45:30 PM, ...

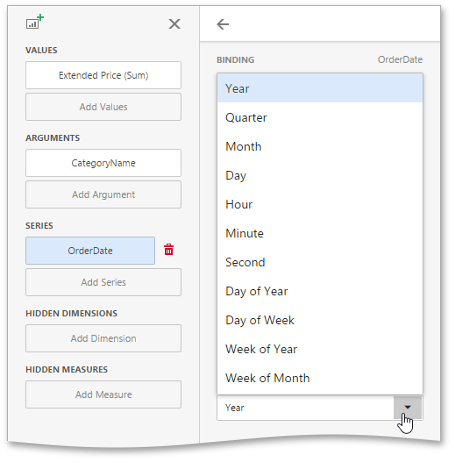
    To specify a date-time group interval in the Web Dashboard, invoke the dashboard item Bindings menu and select the required data item. In the Bindings section, select the desired interval from the drop-down Group Interval list.

    wdd-change-grouping-interval

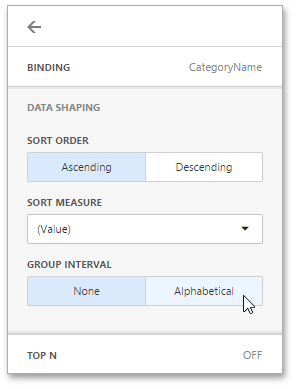
    Changing a Text Group Interval

    String values support the following grouping intervals.

    • No Grouping: each value is displayed "as is".
    • Alphabetical: values are grouped alphabetically (e.g., A, B, C, ... Z).

    For string values, go to the Data Shaping section of the data item menu. Here, you can change the group interval to alphabetical.

    wdd-change-grouping-interval-text

    Back to top Copyright © 2020 Metric d.o.o. www.mymetric.net, metric@zg.t-com.hr