• Metric Reports for Web
  • Dashboard for Web

    Show / Hide Table of Contents
    • Web Dashboard - Designer Mode
      • Creating a Dashboard
      • Providing Data
        • Create a New Data Source
        • Connect to an Existing Data Source
        • Dashboard Data Source Wizard
          • Specify Data Source Settings (Database)
          • Specify Data Source Settings (JSON)
          • Specify Data Source Settings (OLAP)
        • Query Builder
        • Preview Data
        • Manage Data Sources
        • Working with SQL Data Sources
          • Manage SQL Queries
          • Filter Queries
          • Pass Query Parameters
          • Stored Procedures
        • Filter Data Sources
        • Calculated Fields
        • Data Inspector
      • Adding Dashboard Items
      • Binding Dashboard Items to Data
        • Binding Dashboard Items to Data in the Web Dashboard
        • Hidden Data Items
        • Binding Dashboard Items to Data in OLAP Mode
      • Designing Dashboard Items
        • Chart
          • Providing Data
          • Series
          • Panes
          • Interactivity
          • Legend
          • Axes
          • Orientation
        • Scatter Chart
          • Providing Data
          • Interactivity
          • Legend
          • Axes
          • Orientation
          • Labels
        • Grid
          • Providing Data
          • Columns
          • Interactivity
          • Conditional Formatting
          • Totals
          • Layout
        • Pies
          • Providing Data
          • Interactivity
          • Layout
          • Labels
          • Style
        • Cards
          • Providing Data
          • Layout
          • Delta
          • Sparkline
          • Formatting
          • Interactivity
          • Cards Arrangement
          • Conditional Formatting
        • Gauges
          • Providing Data
          • Delta
          • Gauge Scale
          • Interactivity
          • Layout
          • Style
        • Pivot
          • Providing Data
          • Interactivity
          • Conditional Formatting
          • Layout
          • Expanded State
        • Choropleth Map
          • Providing Maps
          • Providing Data
          • Delta
          • Map Navigation
          • Interactivity
          • Labels
          • Legend
        • Geo Point Maps
          • Map Types Overview
          • Providing Maps
          • Geo Point Map
            • Providing Data
          • Bubble Map
            • Providing Data
            • Legends
          • Pie Map
            • Providing Data
            • Pie Options
            • Coloring
            • Legends
          • Clustering
          • Map Navigation
          • Interactivity
          • Labels
        • Range Filter
          • Providing Data
          • Series
          • Interactivity
          • Predefined Periods
        • Date Filter
        • Images
          • Image Overview
          • Providing Images
          • Interactivity
          • Image Settings
        • Text Box
        • Treemap
          • Providing Data
          • Interactivity
          • Layout
          • Grouping
          • Coloring
          • Labels
        • Filter Elements
          • Filter Elements Overview
          • Providing Data
          • Interactivity
        • Dashboard Item Group
        • Tab Container
      • Data Shaping
        • Summarization
        • Grouping
        • Sorting
        • Filtering
        • Top N
        • Formatting Data
      • Interactivity
        • Master Filtering
        • Drill-Down
        • Neutral Filter Mode
      • Appearance Customization
        • Conditional Formatting
        • Coloring
        • Themes
      • Data Analysis
        • Aggregations
        • Calculations
        • Dashboard Parameters
          • Creating Parameters
          • Passing Parameter Values
          • Requesting Parameter Values
        • Expression Constants, Operators, and Functions
      • Converting Dashboard Items
      • Dashboard Layout
        • Dashboard Title
        • Dashboard Item Caption
        • Dashboard Items Layout
      • Undo and Redo Operations
      • Saving a Dashboard
      • Opening a Dashboard
      • Exporting
      • UI Elements
        • Toolbox
        • Dashboard Surface
        • Dashboard Menu
        • Dashboard Item Menu
        • Data Item Menu
    • Web Dashboard - Viewer Mode
      • Data Presentation
        • Data Presentation Basics
        • Master Filtering
        • Drill-Down
        • Dashboard Layout
      • Mobile Layout
      • Dashboard Parameters
        • Requesting Parameter Values
      • Exporting
      • Dashboard Items
        • Chart
          • Data Presentation Basics
          • Interactivity
          • Exporting
        • Scatter Chart
          • Data Presentation Basics
          • Interactivity
          • Exporting
        • Grid
          • Data Presentation Basics
          • Interactivity
          • Exporting
        • Pies
          • Data Presentation Basics
          • Interactivity
          • Exporting
        • Cards
          • Data Presentation Basics
          • Interactivity
          • Exporting
        • Gauges
          • Data Presentation Basics
          • Interactivity
          • Exporting
        • Pivot
          • Exporting
        • Choropleth Map
          • Data Presentation Basics
          • Interactivity
          • Exporting
        • Geo Point Maps
          • Data Presentation Basics
          • Interactivity
          • Exporting
        • Range Filter
          • Exporting
        • Image
          • Exporting
        • Text Box
          • Exporting
        • Treemap
          • Data Presentation Basics
          • Interactivity
          • Exporting
        • Filter Elements
        • Tab Container

    Query Builder

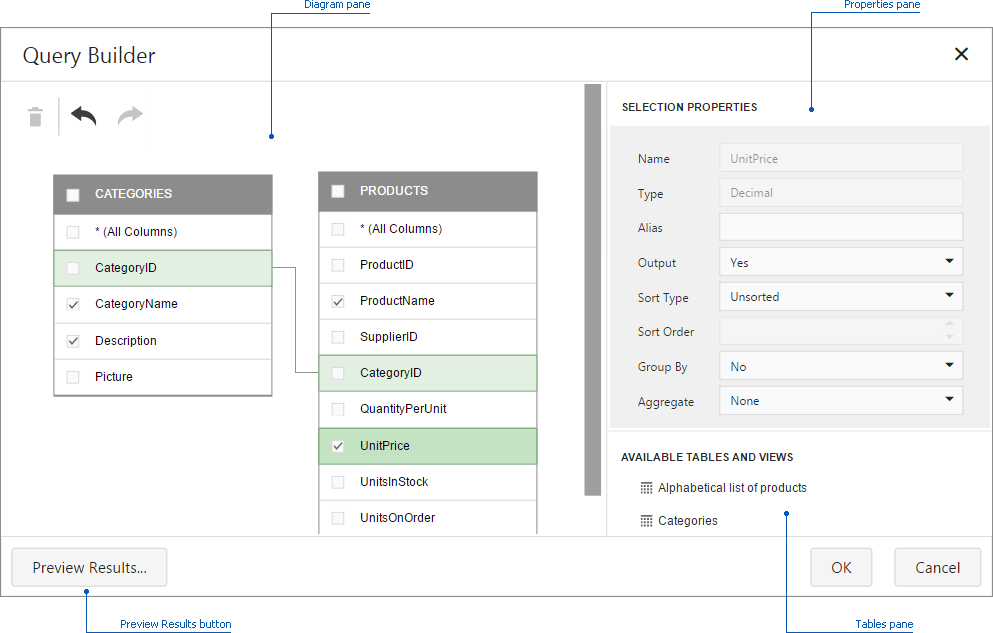
    In the Query Builder dialog, you can add data tables and views to the data source, and select which columns to include. The Query Builder automatically joins the related tables, so all you need to do is drag-and-drop.

    wdd-query-builder

    This topic consists of the following sections.

    • Add Tables
    • Join Tables
    • Edit Column Settings
    • Filter Data
    • Preview Data

    Add Tables

    To add the required tables/views to a data source, drag-and-drop it from the Tables pane onto the Diagram pane.

    wdd-query-builder-add-table

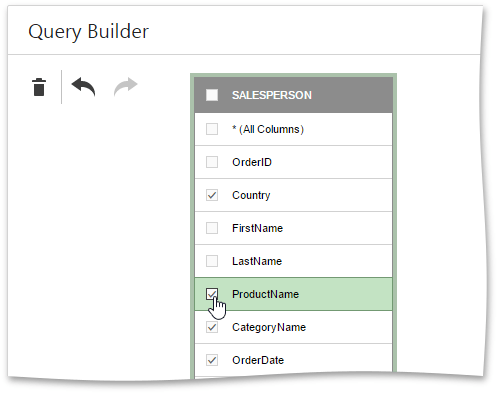
    Then, select the required columns.

    wdd-query-builder-select-column

    To delete the unnecessary table, select it and click the Delete button (the wdd-query-builder-delete-icon icon).

    You can cancel or repeat the action using the Undo/Redo buttons (the wdd-query-builder-undo and wdd-query-builder-redo icons).

    Join Tables

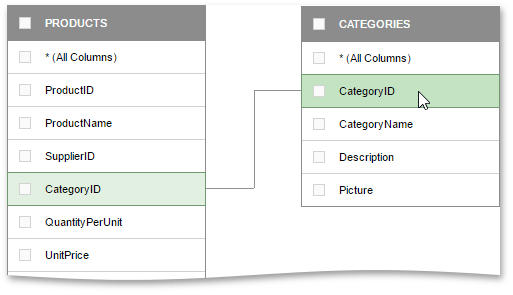
    When you drop a table that has a relationship at the database level with any of the recently added tables, the Query Builder joins these tables automatically.

    wdd-query-builder-join-tables

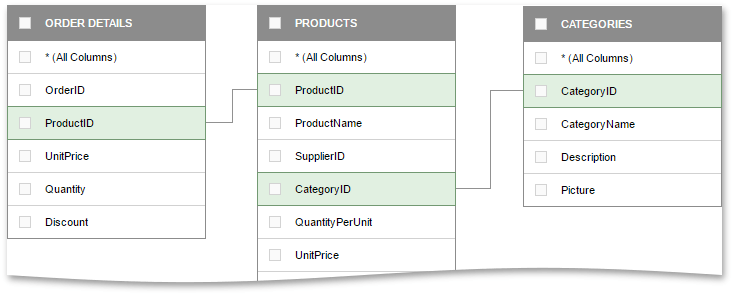
    You can create a relationship between two tables manually by dragging a column in one table to a related column in a different table. A relationship line will be drawn between the two tables.

    wdd-query-builder-join-tables-manually

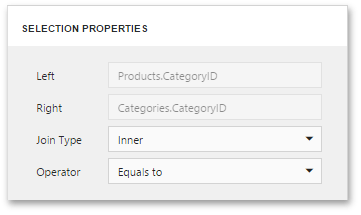
    The Query Builder allows you to change the join type (if necessary). For this, select the relationship line and use the Join type combo box in the Properties pane. An Inner join and Left outer join are supported.

    wdd-query-builder-ralstionship-properties

    To delete the unnecessary relationship, select the relationship line and click the Delete button (the wdd-query-builder-delete-icon icon).

    Edit Column Settings

    To edit a column setting, select the required column in a table. Then, use the Properties pane to specify the column setting.

    The following settings are available for each column.

    wdd-queru-builder-properties-pane

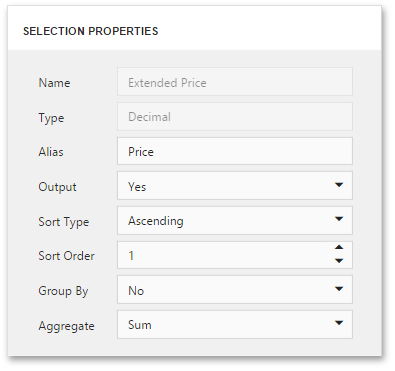
    • The Name field displays the selected column name.
    • The Type field displays the selected column type.
    • The Alias field allows you to specify the column alias.

      Note

      Note that aggregated columns should always have an alias.

    • The Output field allows you to choose whether to include the selected column to the query.
    • Use Sort Type to specify the sort order of column values.
    • The Sort Order field allows you to specify the order in which several columns are sorted.
    • The Group By option allows you to group data by the values of the selected column.
    • The Aggregate field allows you to specify the aggregate function used to aggregate column values.

      Note

      Note that you should apply aggregation/grouping either to all columns or to none of them.
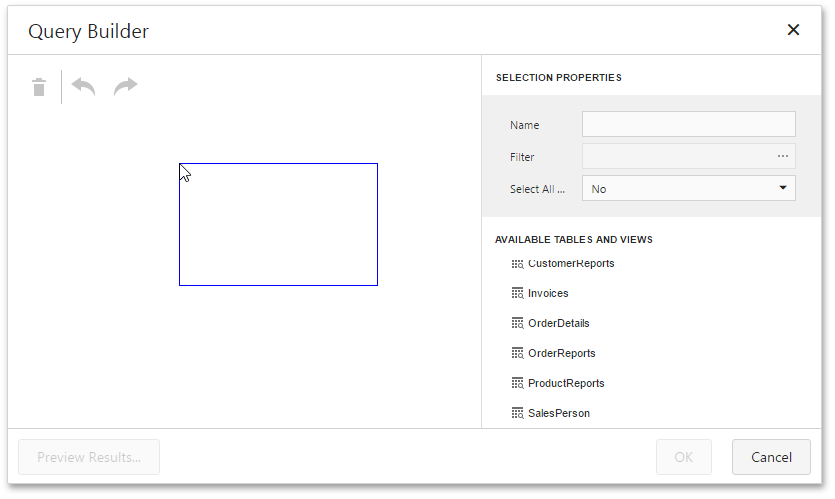
    Filter Data

    The Query Builder allows you to filter a query. To do this, deselect tables and click the ellipsis button in the appeared Filter field in the Properties pane. This invokes the Filter Editor dialog, which provides a visual interface for constructing a filter string.

    wdd-filter-editor-filter-query

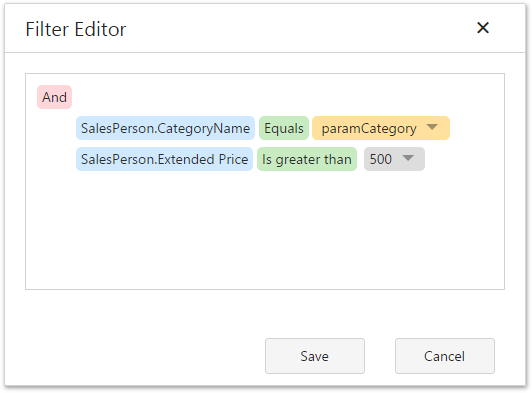
    To learn more, see Filter Queries.

    Preview Data

    The Query Builder allows you to preview data for the created SQL query. To do this, click the Preview Results... button. This invokes the Data Preview window containing data returned after executing the query.

    Back to top Copyright © 2020 Metric d.o.o. www.mymetric.net, metric@zg.t-com.hr