• Metric Reports for Web
  • Dashboard for Web

    Show / Hide Table of Contents
    • Web Dashboard - Designer Mode
      • Creating a Dashboard
      • Providing Data
        • Create a New Data Source
        • Connect to an Existing Data Source
        • Dashboard Data Source Wizard
          • Specify Data Source Settings (Database)
          • Specify Data Source Settings (JSON)
          • Specify Data Source Settings (OLAP)
        • Query Builder
        • Preview Data
        • Manage Data Sources
        • Working with SQL Data Sources
          • Manage SQL Queries
          • Filter Queries
          • Pass Query Parameters
          • Stored Procedures
        • Filter Data Sources
        • Calculated Fields
        • Data Inspector
      • Adding Dashboard Items
      • Binding Dashboard Items to Data
        • Binding Dashboard Items to Data in the Web Dashboard
        • Hidden Data Items
        • Binding Dashboard Items to Data in OLAP Mode
      • Designing Dashboard Items
        • Chart
          • Providing Data
          • Series
          • Panes
          • Interactivity
          • Legend
          • Axes
          • Orientation
        • Scatter Chart
          • Providing Data
          • Interactivity
          • Legend
          • Axes
          • Orientation
          • Labels
        • Grid
          • Providing Data
          • Columns
          • Interactivity
          • Conditional Formatting
          • Totals
          • Layout
        • Pies
          • Providing Data
          • Interactivity
          • Layout
          • Labels
          • Style
        • Cards
          • Providing Data
          • Layout
          • Delta
          • Sparkline
          • Formatting
          • Interactivity
          • Cards Arrangement
          • Conditional Formatting
        • Gauges
          • Providing Data
          • Delta
          • Gauge Scale
          • Interactivity
          • Layout
          • Style
        • Pivot
          • Providing Data
          • Interactivity
          • Conditional Formatting
          • Layout
          • Expanded State
        • Choropleth Map
          • Providing Maps
          • Providing Data
          • Delta
          • Map Navigation
          • Interactivity
          • Labels
          • Legend
        • Geo Point Maps
          • Map Types Overview
          • Providing Maps
          • Geo Point Map
            • Providing Data
          • Bubble Map
            • Providing Data
            • Legends
          • Pie Map
            • Providing Data
            • Pie Options
            • Coloring
            • Legends
          • Clustering
          • Map Navigation
          • Interactivity
          • Labels
        • Range Filter
          • Providing Data
          • Series
          • Interactivity
          • Predefined Periods
        • Date Filter
        • Images
          • Image Overview
          • Providing Images
          • Interactivity
          • Image Settings
        • Text Box
        • Treemap
          • Providing Data
          • Interactivity
          • Layout
          • Grouping
          • Coloring
          • Labels
        • Filter Elements
          • Filter Elements Overview
          • Providing Data
          • Interactivity
        • Dashboard Item Group
        • Tab Container
      • Data Shaping
        • Summarization
        • Grouping
        • Sorting
        • Filtering
        • Top N
        • Formatting Data
      • Interactivity
        • Master Filtering
        • Drill-Down
        • Neutral Filter Mode
      • Appearance Customization
        • Conditional Formatting
        • Coloring
        • Themes
      • Data Analysis
        • Aggregations
        • Calculations
        • Dashboard Parameters
          • Creating Parameters
          • Passing Parameter Values
          • Requesting Parameter Values
        • Expression Constants, Operators, and Functions
      • Converting Dashboard Items
      • Dashboard Layout
        • Dashboard Title
        • Dashboard Item Caption
        • Dashboard Items Layout
      • Undo and Redo Operations
      • Saving a Dashboard
      • Opening a Dashboard
      • Exporting
      • UI Elements
        • Toolbox
        • Dashboard Surface
        • Dashboard Menu
        • Dashboard Item Menu
        • Data Item Menu
    • Web Dashboard - Viewer Mode
      • Data Presentation
        • Data Presentation Basics
        • Master Filtering
        • Drill-Down
        • Dashboard Layout
      • Mobile Layout
      • Dashboard Parameters
        • Requesting Parameter Values
      • Exporting
      • Dashboard Items
        • Chart
          • Data Presentation Basics
          • Interactivity
          • Exporting
        • Scatter Chart
          • Data Presentation Basics
          • Interactivity
          • Exporting
        • Grid
          • Data Presentation Basics
          • Interactivity
          • Exporting
        • Pies
          • Data Presentation Basics
          • Interactivity
          • Exporting
        • Cards
          • Data Presentation Basics
          • Interactivity
          • Exporting
        • Gauges
          • Data Presentation Basics
          • Interactivity
          • Exporting
        • Pivot
          • Exporting
        • Choropleth Map
          • Data Presentation Basics
          • Interactivity
          • Exporting
        • Geo Point Maps
          • Data Presentation Basics
          • Interactivity
          • Exporting
        • Range Filter
          • Exporting
        • Image
          • Exporting
        • Text Box
          • Exporting
        • Treemap
          • Data Presentation Basics
          • Interactivity
          • Exporting
        • Filter Elements
        • Tab Container

    Manage Data Sources

    The Web Dashboard allows you to manage the dashboard's data sources. To do this, open the dashboard menu and go to the Data Sources page. Here you can add new data sources to the current dashboard or remove the existing data source.

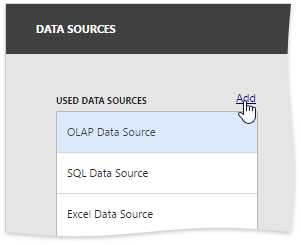
    To add a new data source, click Add next to the Used Data Sources list.

    WDD-add-data-source-to-the-collection

    The Add Data Source window is invoked. Here you can perform the following actions.

    • Click Create to invoke the Dashboard Data Source Wizard where you can create a new data source based on the predefined data connection.
    • Select the existing data source from the list.

    WDD-include-selected-data-source-to-the-dashboard

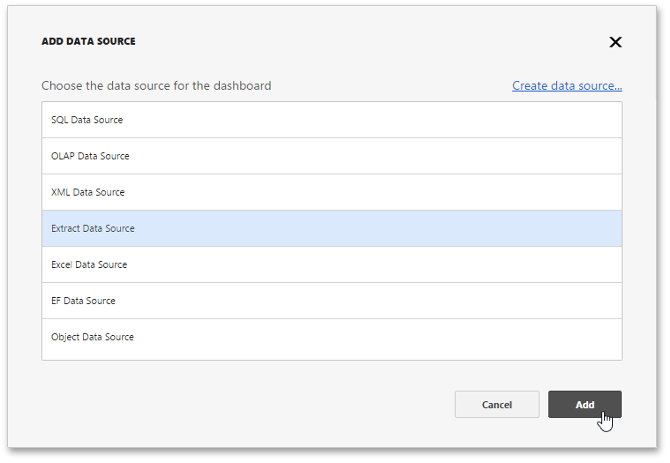
    After that, click Add to add the selected data source to the dashboard data sources.

    The added data source will be displayed in the Used Data Sources section. You can use the added data sources to change the data source of the created dashboard items.

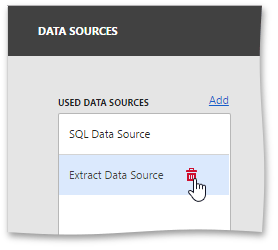
    To remove the existing data source from the dashboard data sources, click Remove ( the WDD-icon-delete-data-source icon).

    wdd-delete-data-source

    Back to top Copyright © 2020 Metric d.o.o. www.mymetric.net, metric@zg.t-com.hr