Create an Invoice Manually
This tutorial describes how to create a simple invoice report displaying information about customers and their orders. You can perform similar steps to create various invoice layouts depending on your requirements.
Create a Report and Bind It to Data
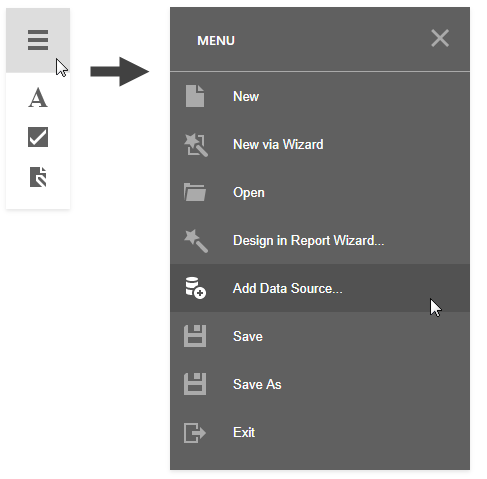
Invoke the designer menu and click Add Data Source....
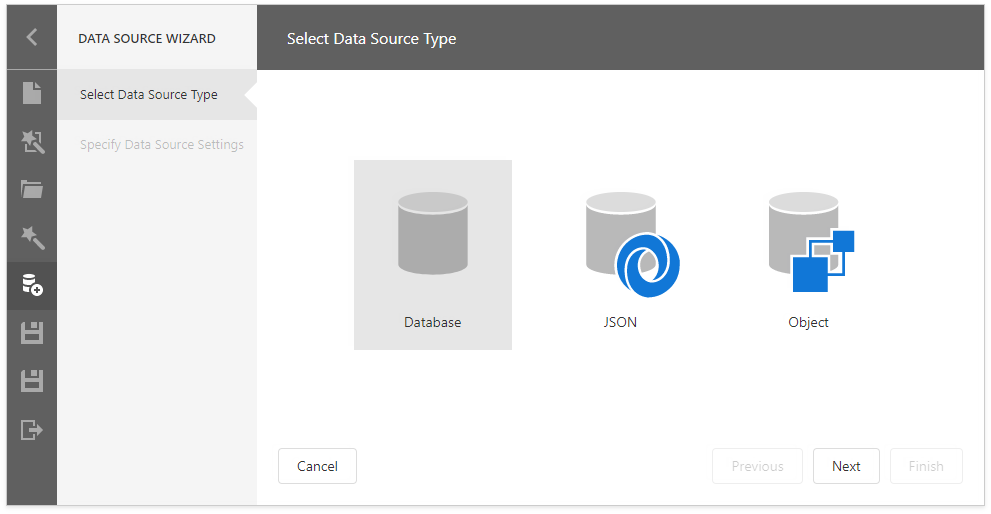
Select Database on the first page of the invoked Data Source Wizard and click Next.
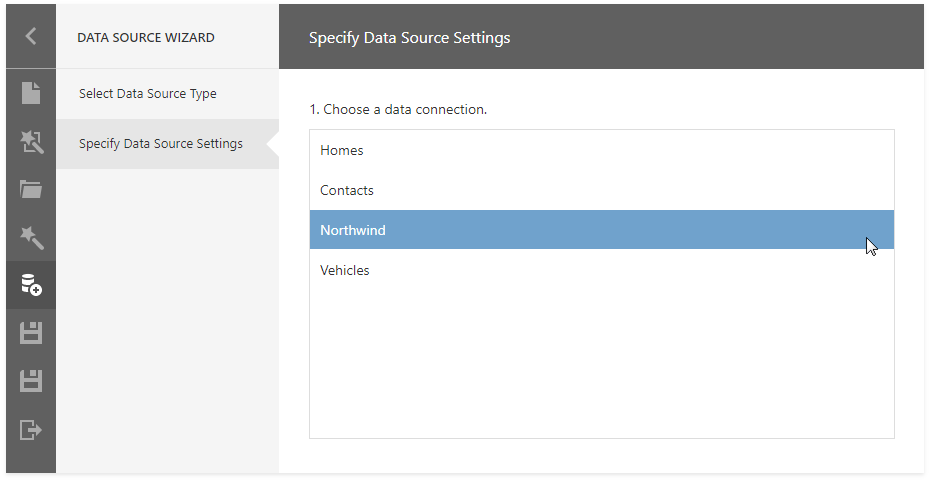
Select a data connection on the next page.
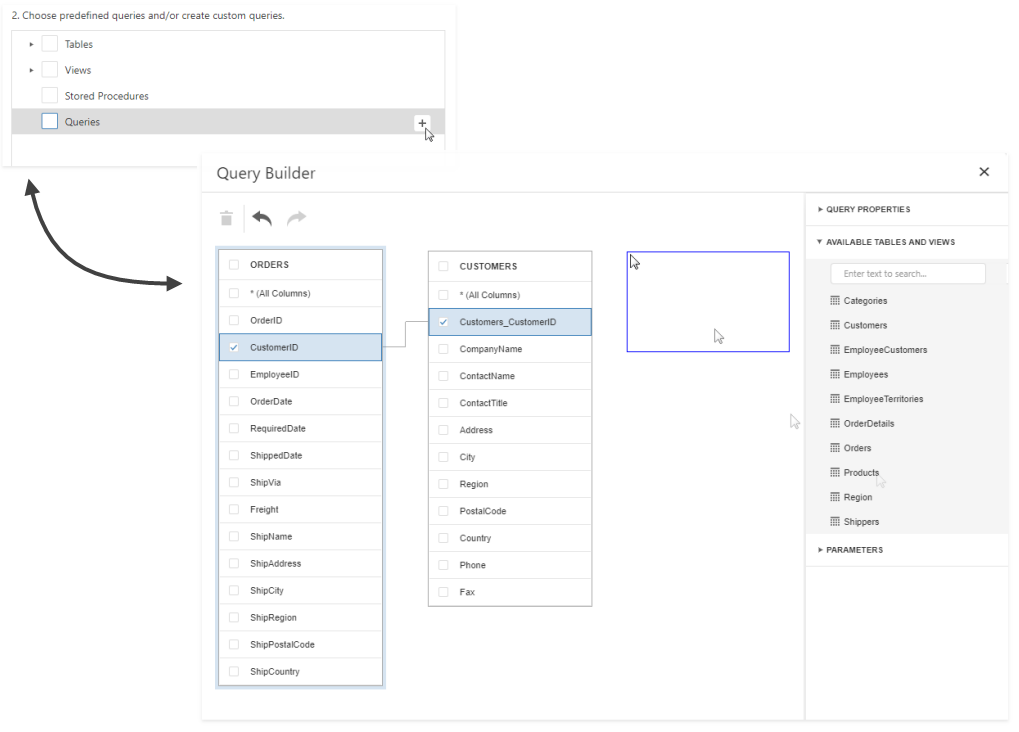
On the same page, you can choose which tables, views and/or stored procedures to add to the report.
Obtain data from two different tables to display information about customers and orders at the same hierarchical level in the report. Click the plus button for the Queries category to create a custom query. In the invoked Query Builder, add the required data tables to a query and join them based on a key column.
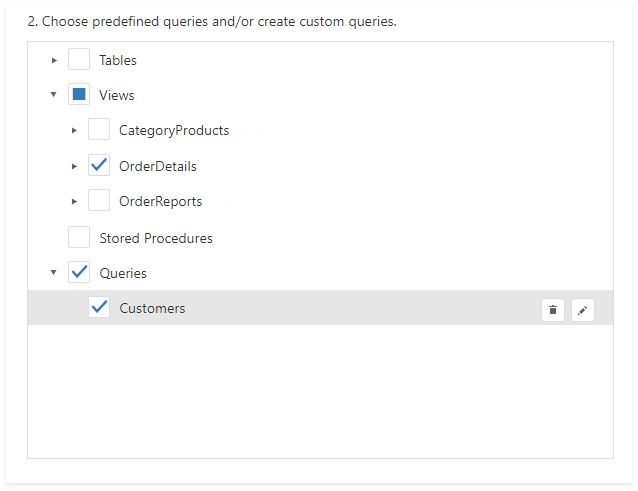
On the same wizard page, select the data view providing order details for listing products included in each order in the invoice.
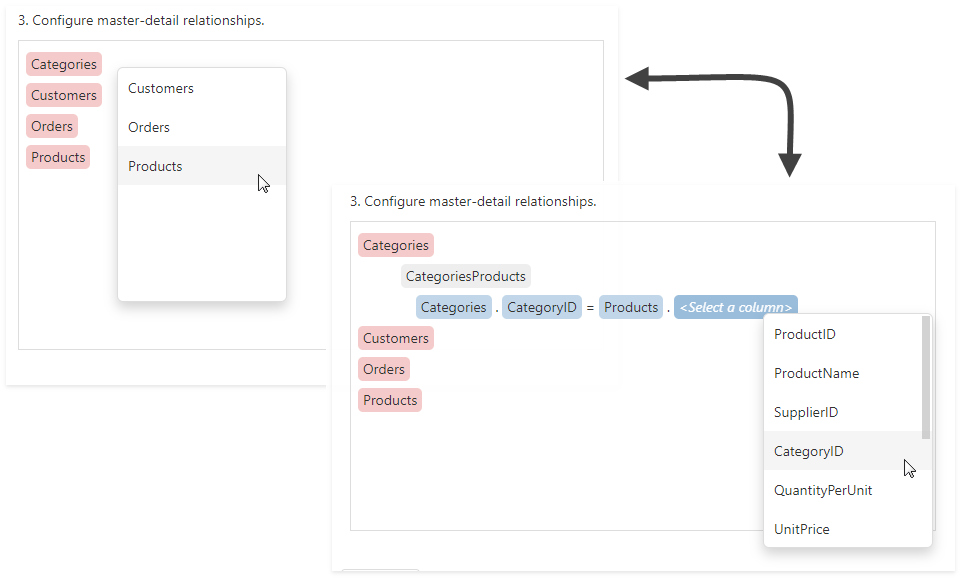
On the same page, specify a master-detail relationship between the queries. Select the required key fields (columns) to connect tables.
Click Finish to complete the wizard.
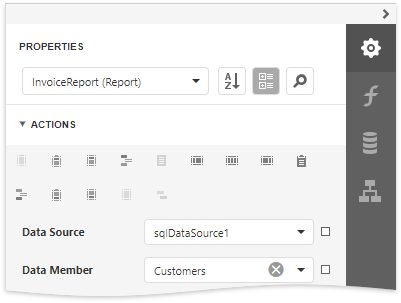
After these steps, make sure that an appropriate data member is assigned to the report.
Prepare the Master Report Layout
Create the master report layout to display basic information about customers and their orders.
Switch to the Field List and drop the required data fields onto the Detail band. New controls of appropriate types are automatically created and bound to the corresponding fields.
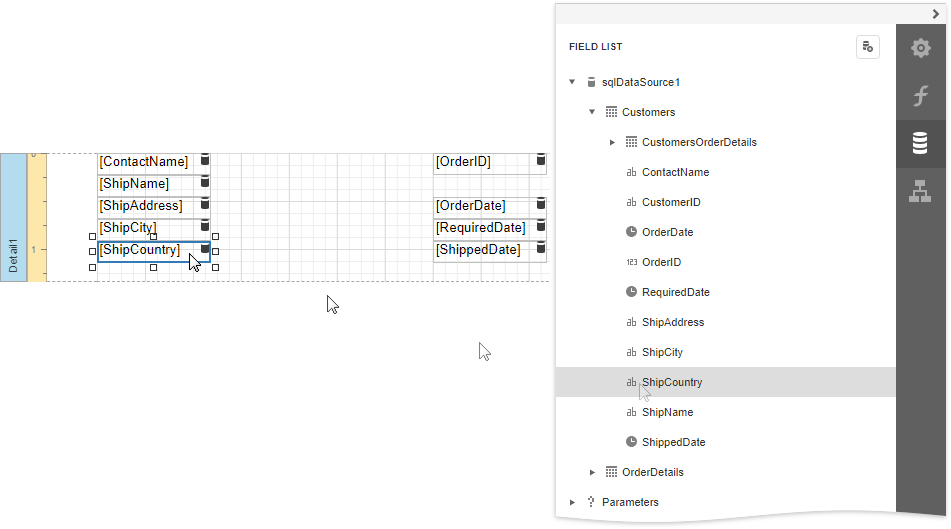
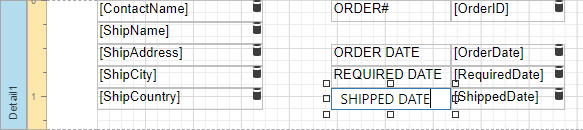
Drop Label controls from the Toolbox onto the band to display static captions for specific data fields.
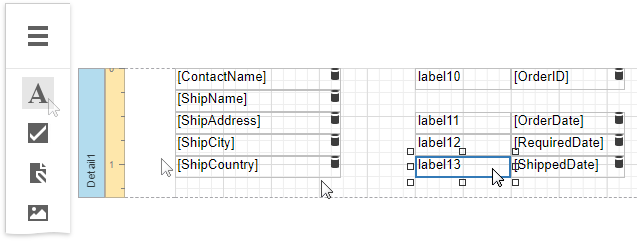
Double-click the added labels one after another and enter the required text.
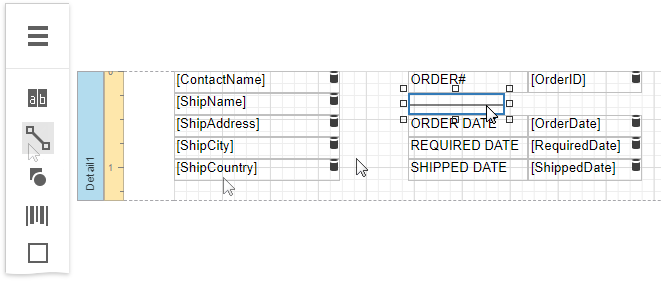
Use the Line control to separate data.
Prepare the Detail Report Layout
Perform the following steps to create a detail report and construct its layout to show the order details in a tabular form:
Expand the Actions category and click Insert Detail Report Band to create a Detail Report Band.
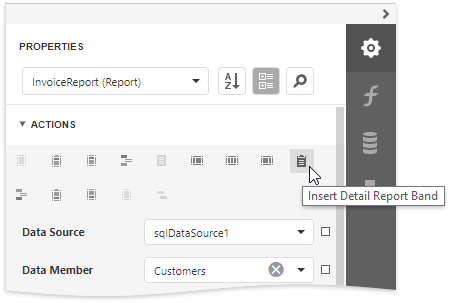
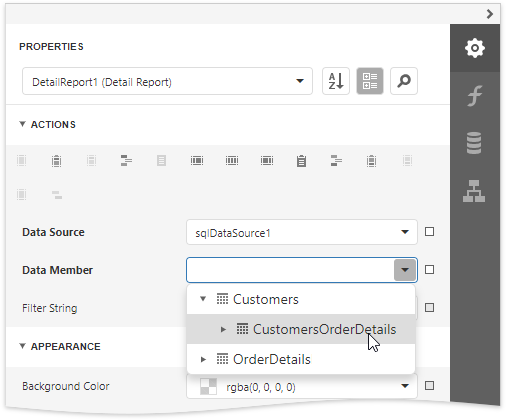
Select the Detail Report band and select the master-detail relationship's name in the Data Member property's drop-down list.
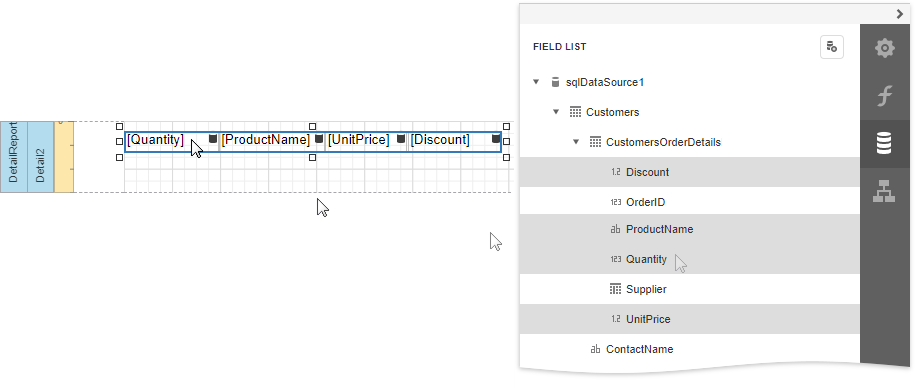
Add dynamic content to the detail report. Go to the Field List, select the data fields while holding down CTRL or SHIFT and drag-and-drop them onto the Detail band. This automatically creates a Table control with table cells bound to the corresponding fields.
You should drag-and-drop fields from the category corresponding to the master-detail relationship to correctly generate the detail report's data.
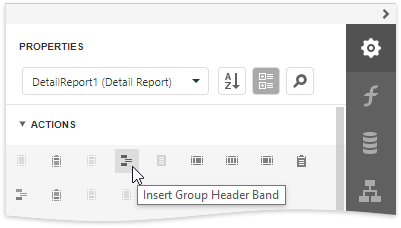
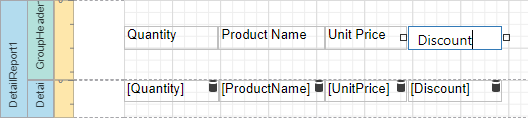
Add the Group Header band to the detail report to display captions for table columns. Select the Detail Report band and click Insert Group Header Band in the Actions category.
To create column headers, drop the Table control from the Toolbox onto the Group Header band and enter the required text in the table's cells.
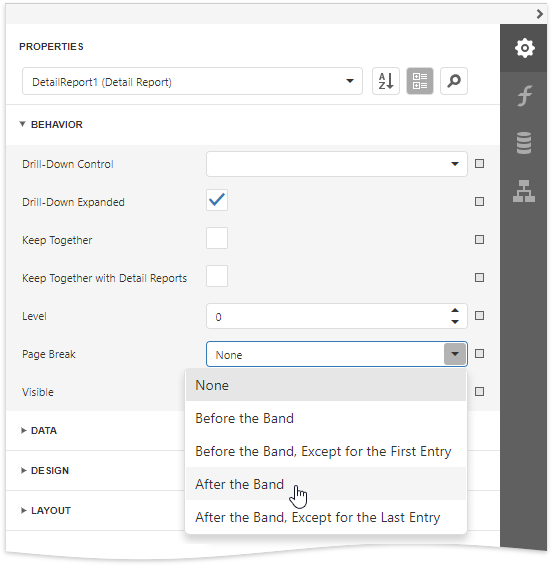
Select the Detail Report band, expand the Behavior category and set the band's Page Break property to After the Band to print each order on a separate page.
Create a Calculated Field
This section demonstrates how to create a custom field whose values are calculated using a pre-defined expression.
Do the following to evaluate an extended price based on the price, quantity and discount values obtained from a database:
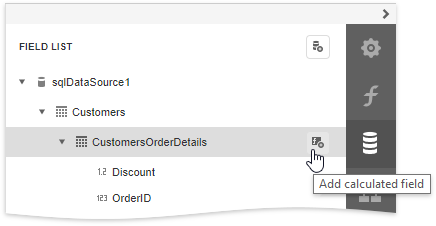
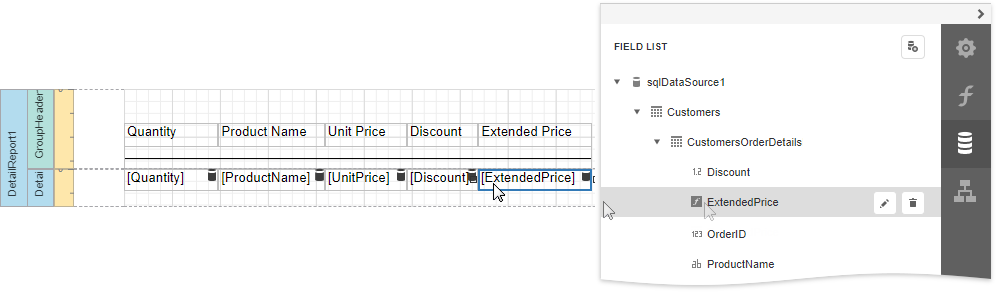
In the Field List, select the detail table and click Add calculated field.
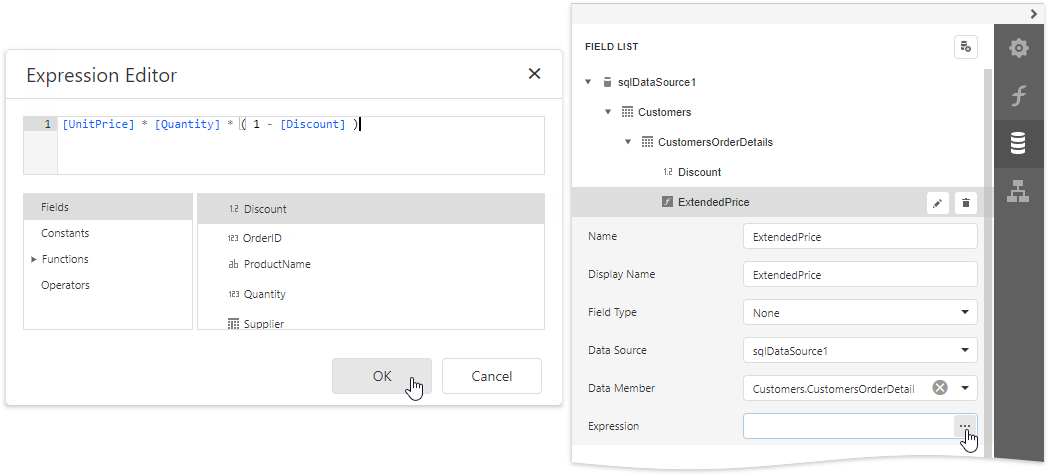
Click the Edit button for the calculated field and change its name to ExtendedPrice. Click the Expression property's ellipsis button, and in the invoked Expression Editor, construct the expression based on the UnitPrice, Quantity and Discount fields.
You can use the created calculated field as an ordinary data field. Add a cell to a table in the Detail band and drop the calculated field onto this cell. Additionally, create one more table cell in the Group Header for displaying the corresponding caption.
Format Data
The next step is to specify report elements' value formatting to improve displaying their incoming data.
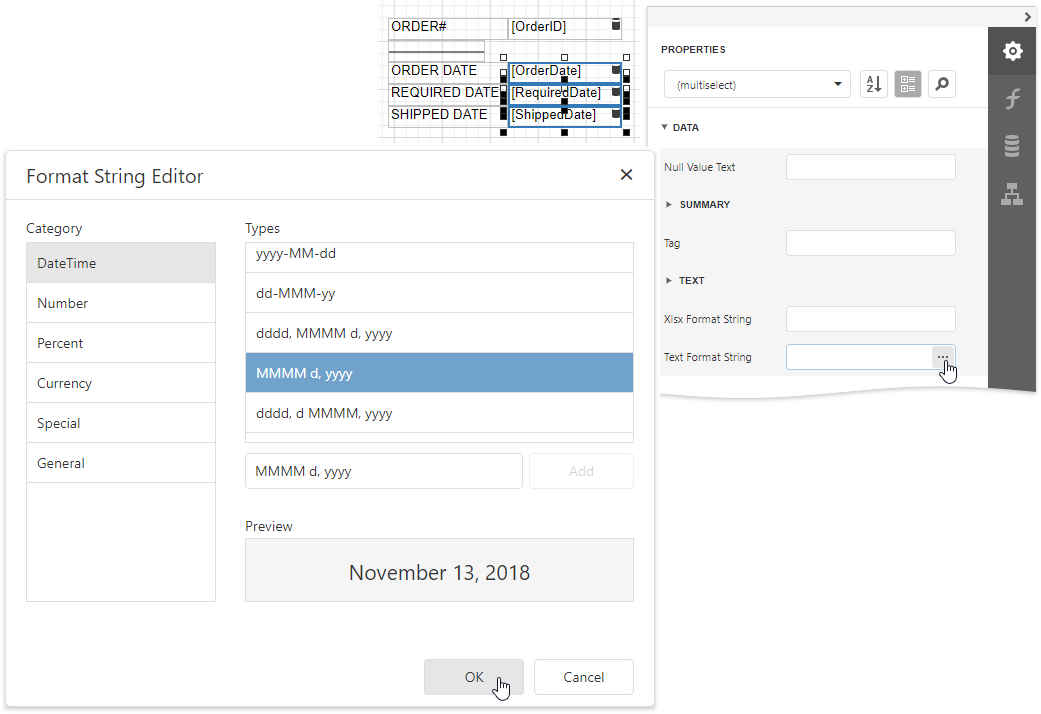
In the master report's Detail band, select controls bound to date fields while holding down CTRL. Switch to the Properties panel, expand the Data category and click the Text Format String property's ellipsis button. In the invoked Format String Editor, activate the DateTime category and select the format, for example, display dates as a month (name) followed by the day (number) and year (four digits).
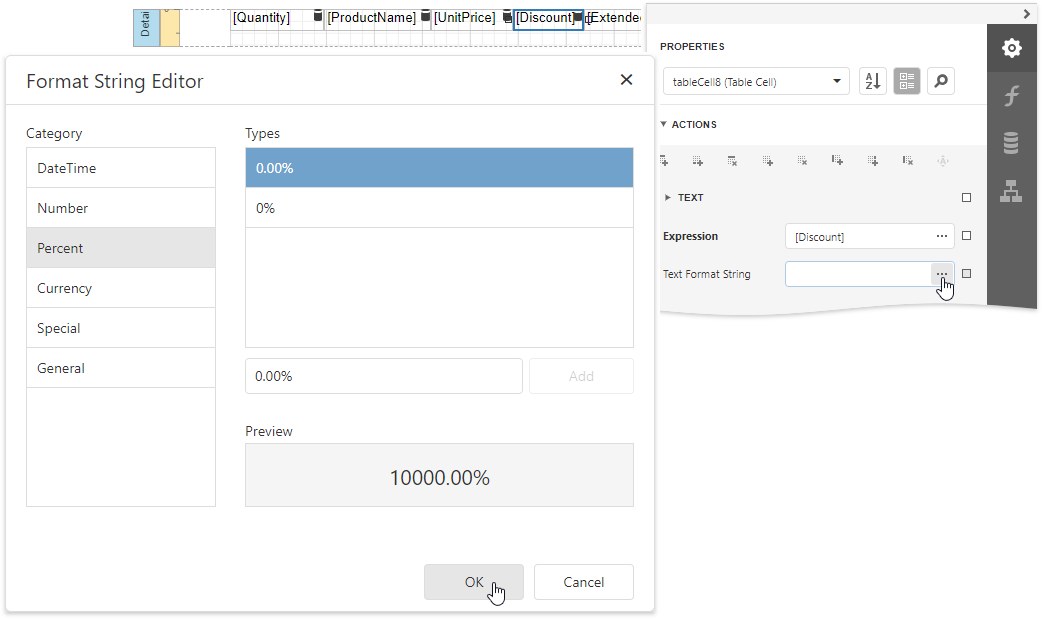
Select the table cell bound to the Discount data field in the detail report's Detail band. Expand the Actions category, click the Text Format String property's ellipsis button, and in the invoked Format String Editor, apply the Percent format. In this case, field values are multiplied by 100 and displayed with a percent symbol.
In the detail report's Detail band, select the cells bound to the UnitPrice and ExtendedPrice fields. Invoke the Format String Editor once again and choose the format preset from the Currency category (for instance, c2).
Calculate a Summary
Do the following to calculate a total price for each order as a sum of Extended Price values:
Add the Group Footer band to the detail report in the same way as the Group Header.
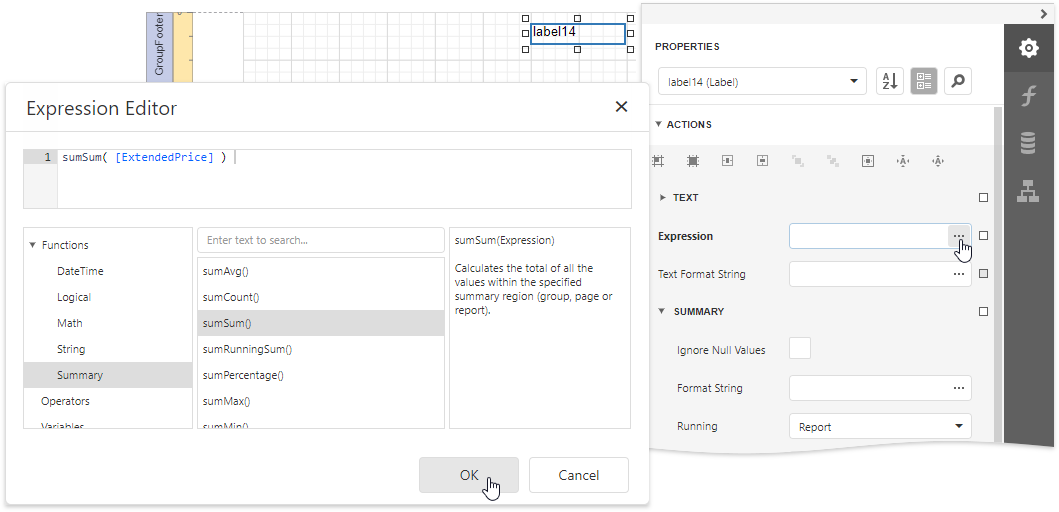
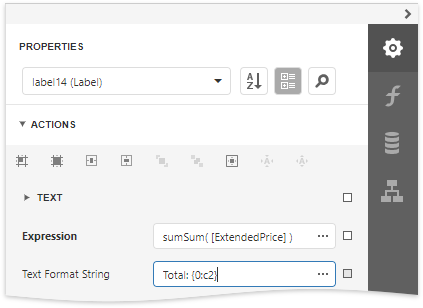
Drop the Label control onto the added band and expand the Actions category in the Properties panel. Select the Summary section and set the Running property to Report to calculate the summary for the entire detail report and click the Expression property's ellipsis button. In the invoked Expression Editor, specify the following expression to calculate the total price:
Use the Text Format String property to format the summary's value (for instance, set it to Total: {0:c2}).
Sort Data
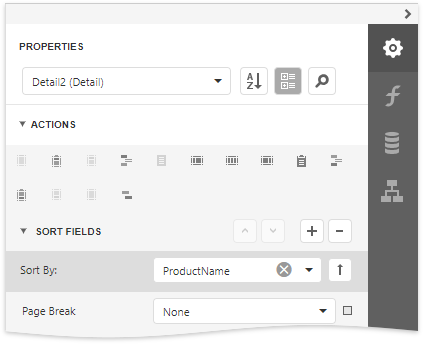
Perform the following steps to sort data in the detail report:
Select the Detail band in the detail report. Select the Sort Fields section in the Actions category and add a new sort field to sort the detail report's data by the required data field.
Click the
 or
or  buttons to define the sort order within the group (ascending or descending). Use the
  button to disable sorting in grouped data.
Customize the Report Appearance
Do the following to customize the report and its elements' appearance:
Click the gray area around the design surface to select the report, and in the Properties panel, specify the font settings. These settings are distributed to all report elements.
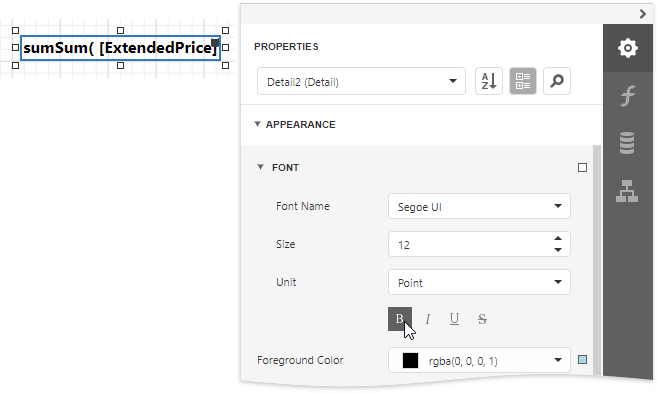
You can adjust a control's font independently from its parent (for instance, make summary values bold).
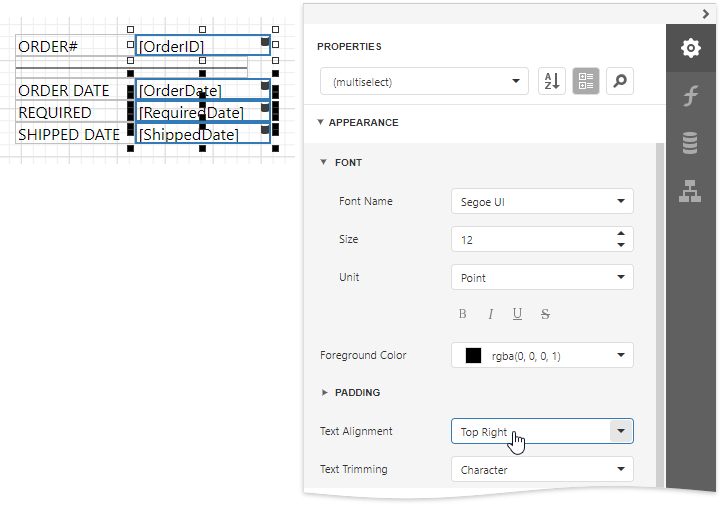
Change specific controls' (bound to date fields, price fields, etc.) text alignment using the Text Alignment property.
Create a global visual style to apply it afterwards to multiple controls. Switch to the Report Explorer panel, select the Styles node and click the plus button
 to add a new report visual style.
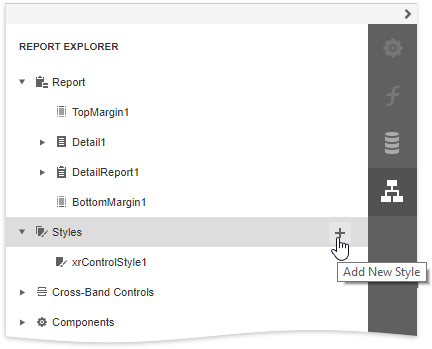
Select the created style and click the Properties
 button in the Report Explorer. This opens the Properties panel where you can adjust the settings of the selected style.
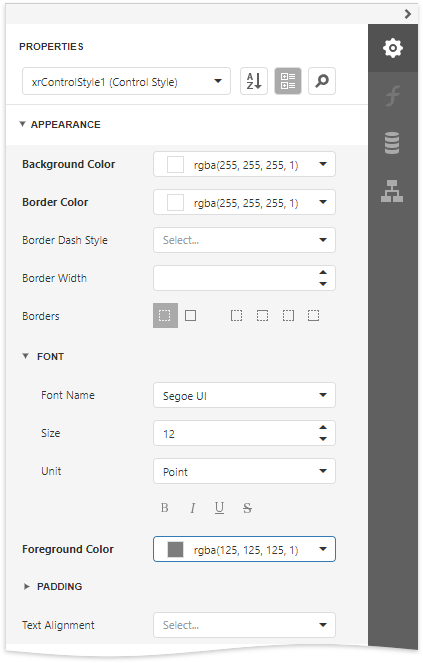
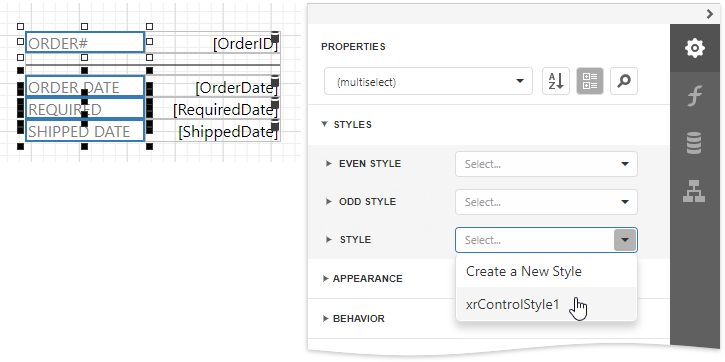
Select report elements, expand the Styles category and choose a style in the Style property's drop-down list to apply the style to the selected elements.
You can provide different appearances to alternating (odd and even) table rows in the detail report. Select the table and expand the Styles property in the Property Grid. Invoke the drop-down list for the EvenStyle property and select New.
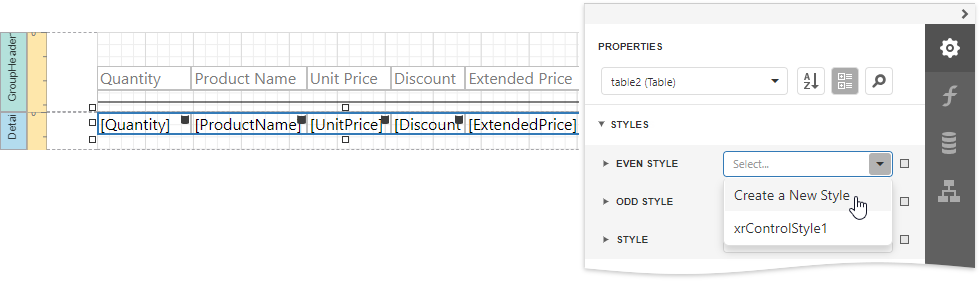
Specify the created style's appearance settings (for example, background color).
Add Additional Information
Do the following to provide additional information to your invoices, such as the report name and current date:
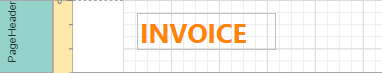
Add the Page Header band to the master report to display the required information on each invoice page.
Drop the Label control from the Toolbox onto the Page Header, double-click the control and type "Invoice". Specify the required appearance settings (font, foreground color, etc.).
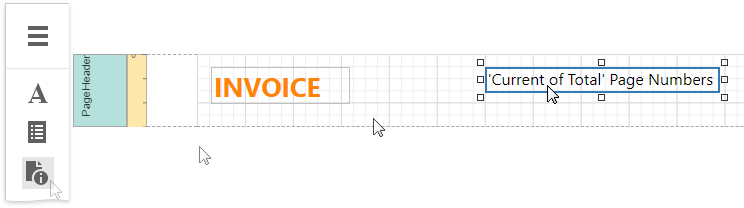
Add the Page Info control to the Page Header band to display system date in the report.
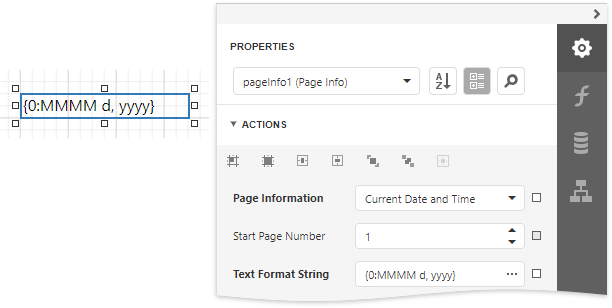
Expand the Actions category and set the Page Information property to Current Date and Time. Click the Text Format String property's ellipsis button, and in the invoked Format String Editor, select a date format as in the Format Data section above.
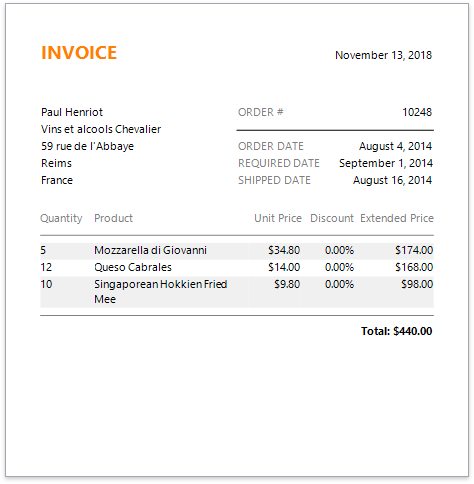
View the Result
The invoice report is now ready. Switch to Print Preview to see the result.