• Metric Reports for Web
  • Dashboard for Web

    Show / Hide Table of Contents
    • Report Designer
      • First Look at the Report Designer
      • Add New Reports
      • Open Reports
      • Save Reports
      • Introduction to Banded Reports
      • Bind to Data
        • Bind a Report to a Database
        • Specify Query Parameters
        • Bind a Report to JSON Data
        • Bind a Report to an Object Data Source
        • Data Binding Modes
        • Bind Report Controls to Data (Expression Bindings)
        • Bind Report Controls to Data (Data Bindings)
        • Use Embedded Fields (Mail Merge)
        • Validate Report Data Bindings
      • Create Popular Reports
        • Create a Letter
        • Create a Table Report
        • Create an Invoice Manually
        • Create a Master-Detail Report (Use Detail Report Bands)
        • Create a Master-Detail Report (Use Subreports)
        • Create a Report with PDF Content
        • Create a Hierarchical Report
        • Create a Vertical Report
        • Create Labels and Badges
        • Create a Multi-Column Report
        • Create a Report with Cross-Band Content and Populated Empty Space
        • Create an Interactive E-Form
        • Create a Cross-Tab Report
      • Configure Design Settings
        • Change a Report's Measurement Units
        • Change a Report's Page Settings
        • Enable the Right-To-Left Layout
      • Use Report Elements
        • Manipulate Report Elements
          • Add Controls to a Report
          • Select Report Elements and Access Their Settings
          • Move and Resize Report Elements
          • Apply Styles to Report Elements
          • Copy Report Controls
          • Arrange Report Controls
          • Add Report Controls to Containers
          • Validate the Report Layout
        • Use Basic Report Controls
          • Label
          • Character Comb
          • Rich Text
          • Check Box
          • Picture Box
          • Subreport
          • Panel
          • Page Break
          • Table of Contents
          • Page Info
        • Use Tables
          • Table Overview
          • Bind Table Cells to Data
          • Manage Table Structure
          • Manipulate Table Elements
          • Hide Table Cells
        • Use Bar Codes
          • Add Bar Codes to a Report
          • Bar Code Recognition Specifics
          • Codabar
          • Code 11 (USD-8)
          • Code 128
          • Code 39 (USD-3)
          • Code 39 Extended
          • Code 93
          • Code 93 Extended
          • EAN 13
          • EAN 8
          • ECC200 - Data Matrix
          • GS1 - DataBar
          • GS1- Data Matrix
          • GS1-128 - EAN-128 (UCC)
          • Industrial 2 of 5
          • Intelligent Mail
          • Intelligent Mail Package
          • Interleaved 2 of 5
          • Matrix 2 of 5
          • MSI - Plessey
          • PDF417
          • PostNet
          • QR Code
          • UPC Shipping Container Symbol (ITF-14)
          • UPC Supplemental 2
          • UPC Supplemental 5
          • UPC-A
          • UPC-E0
          • UPC-E1
        • Use Charts and Pivot Grids
          • Use Charts in Reports
          • Add a Chart (Set Up Series Manually)
          • Add a Chart (Use a Series Template)
          • Use Charts to Visualize Grouped Data
          • Link a Chart and a Pivot Grid
        • Use Gauges and Sparklines
          • Add Gauges to a Report
          • Add Sparklines to a Report
        • Draw Lines and Shapes
          • Draw Lines
          • Draw Shapes
          • Draw Cross-Band Lines and Boxes
      • Shape Report Data
        • Filter Data
          • Filter Data at the Report Level
          • Filter Data at the Data Source Level
          • Limit the Number of Records to Display
        • Group and Sort Data
          • Sort Data
          • Group Data
          • Sort Data by a Custom Field
          • Group Data by a Custom Field
          • Sort Groups by a Summary Function's Result
        • Shape Data (Expression Bindings)
          • Format Data
          • Conditionally Change a Control's Appearance
          • Conditionally Change a Label's Text
          • Conditionally Change a Band's Visibility
          • Conditionally Filter Report Data
          • Conditionally Suppress Controls
          • Limit the Number of Records per Page
          • Calculate a Summary
          • Calculate an Advanced Summary
          • Display Row Numbers in a Report, Group or Page
          • Count the Number of Records in a Report or Group
          • Count the Number of Groups in a Report
        • Shape Data (Data Bindings)
          • Format Data
          • Conditionally Change a Control's Appearance
          • Conditionally Change a Label's Text
          • Conditionally Change a Band's Visibility
          • Conditionally Filter Report Data
          • Conditionally Suppress Controls
          • Limit the Number of Records per Page
          • Calculate a Summary
          • Calculate a Custom Summary
          • Display Row Numbers in a Report, Group or Page
          • Count the Number of Records in a Report or Group
          • Count the Number of Groups in a Report
        • Use Calculated Fields
          • Calculated Fields Overview
          • Calculate an Aggregate Function
          • Calculate a Weighted Average Function
        • Use Report Parameters
          • Create a Report Parameter
          • Report Parameters with Predefined Static Values
          • Report Parameters with Predefined Dynamic Values
          • Multi-Value Report Parameters
          • Cascading Report Parameters
          • Date Range Report Parameters
      • Lay out Dynamic Report Content
        • Maintain the Band Location on a Page
        • Keep Content Together
        • Maintain the Size and Content of Data-Bound Controls
        • Anchor Controls
        • Suppress Controls
      • Customize Appearance
        • Appearance Properties
        • Report Visual Styles
      • Add Navigation
        • Add Page Numbers
        • Add Cross-References and Hyperlinks
        • Add Bookmarks and a Document Map
        • Create a Table of Contents
      • Provide Interactivity
        • Create Drill-Down Reports
        • Sort a Report in Print Preview
        • Edit Content in Print Preview
      • Add Extra Information
        • Add Watermarks to a Report
        • Display the Current Date and Time in a Report
        • Display the User Name in a Report
      • Merge Reports
        • Add a Report to the End/Beginning
        • Use Data-Driven Page Sequence
      • Use Expressions
        • Expression Syntax
      • Localize Reports
      • Preview, Print and Export Reports
      • Report Designer Tools
        • Report Wizard
          • Empty Report
          • Table and Vertical Report
            • Select Data Source
            • Specify Data Source Settings (Database)
            • Specify Data Source Settings (JSON)
            • Specify Data Source Settings (Object)
            • Define Report Layout
            • Specify Page Settings
          • Label Report
        • Data Source Wizard
          • Specify Data Source Settings (Database)
          • Specify Data Source Settings (JSON)
          • Specify Data Source Settings (Object)
        • Design Surface
        • Main Menu
        • Main Toolbar
        • Toolbox
        • Query Builder
        • Chart Designer
        • Expression Editor
        • Filter Editor
        • Format String Editor
        • Master-Detail Relation Editor
        • Script Editor
        • Localization Editor
        • UI Panels
          • Properties Panel
          • Expressions Panel
          • Field List
          • Report Explorer
    • Metric Report Manager
      • First look at the report manager
      • End user management
      • Open a report using the Report Manager
      • Add new report to the Report Manager

    Introduction to Banded Reports

    Banded reports provide a generalized report layout notion. When you preview a banded report, a report document is generated based on the report layout and data source.

    Report Bands

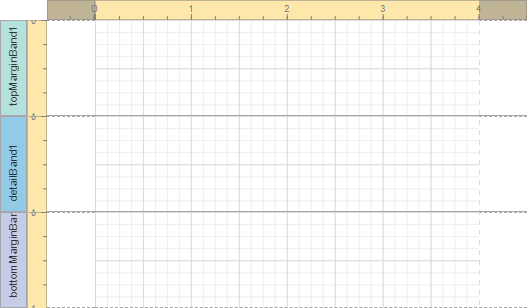
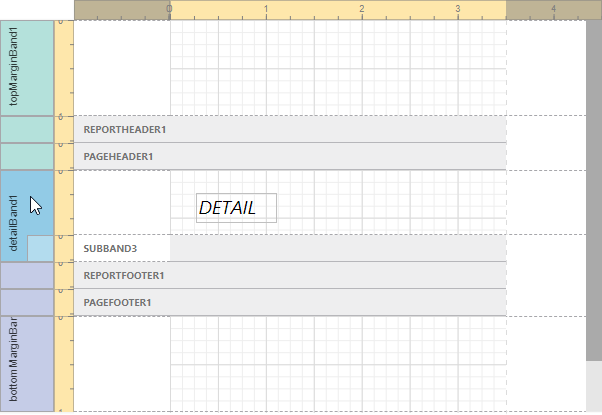
    A report layout consists of bands that contain report controls and define their location on document pages. A blank report contains the following bands:

    • The Detail Band displays recurring contents from the report's data source. This band is printed as many times as there are records available in a data source unless you filtered the data.

      Every report must have a detail band, and you cannot delete it.

    • The top and bottom page Margin bands. These bands are repeated once on every document page.

    You can also add the following bands:

    • Report Header and Report Footer

      The Report Header is the report's first band (margins are "out-of-page" zones). Use this band to display the report's name, company logo, date of creation, username, etc.

      The Report Footer is placed before the Page Footer and Bottom Margin on the report's last page. You can use the Report Footer band for report summaries or conclusions.

    • Page Header and Page Footer

      These bands are at the top and bottom of every page in a report. They display information that should be printed on every page.

    • Group Header and Group Footer

      These bands are above and below each group.

    Tip

    Only the detail and group bands can be used to display dynamic data source contents. Other bands display titles, summaries, and extra information.

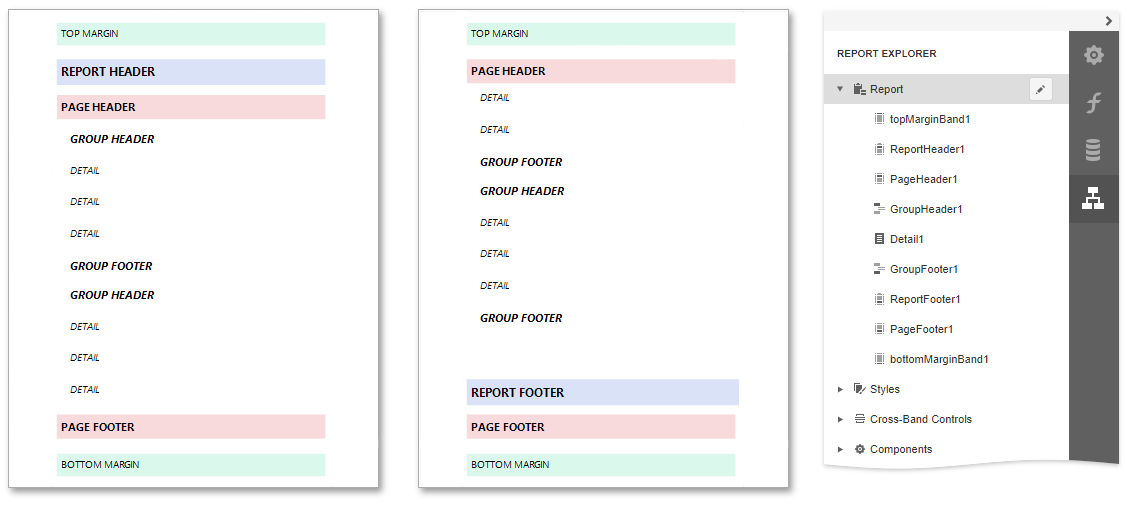
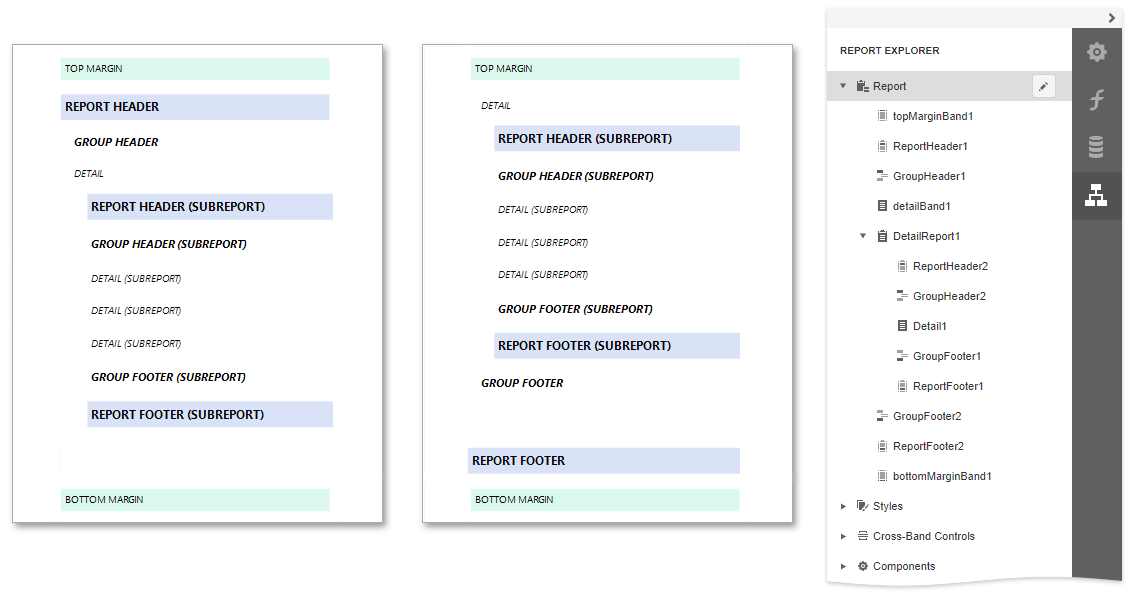
    The following image illustrates a sample report layout and the Report Explorer panel that reflects the report's structure:

    Add a Detail Band to a Master-Detail Band

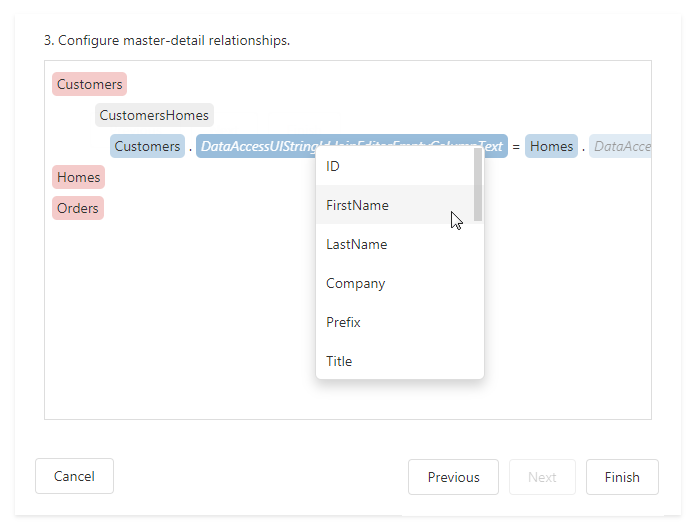
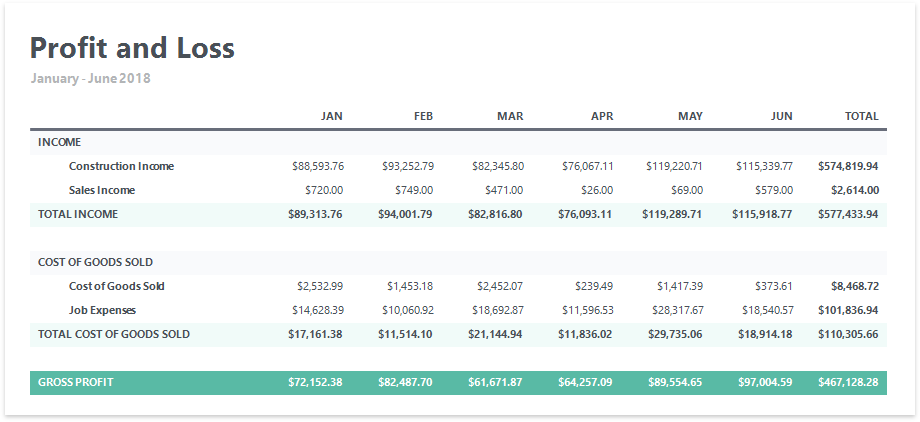
    Use the detail report band to create hierarchical master-detail reports. Detail report bands provide detailed information about each record in the master report's detail band. You can create such reports when master-detail relationships are defined between data source tables:

    A detail report band is a separate report (subreport) with its own data source and different bands. A report can have any number of detail reports that can also be nested.

    The following image illustrates a master-detail report and the Report Explorer panel that reflects the report's structure:

    Vertical Bands

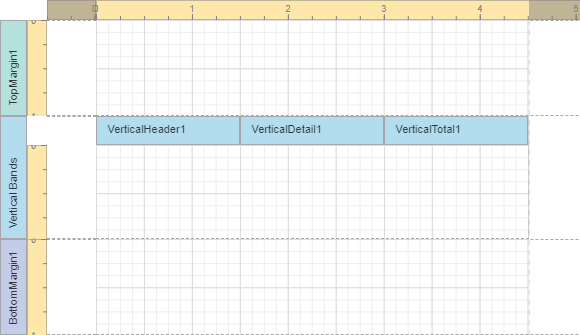
    You can replace the Detail band with the Vertical Header, Vertical Detail and Vertical Total bands to display record fields vertically and print data records horizontally - from left to right.

    Note

    If your report's Detail band contains report controls, this band and all these controls are lost when you add a vertical band (the same behavior takes place in the opposite situation).

    The following vertical bands are available:

    • Vertical Header

      Contains headers of the report's data fields. These headers are arranged one after another in a vertical direction.

    • Vertical Details

      Displays recurring contents from the report's data source. This band is printed as many times as there are available records in a data source, unless you filtered the data. The records are displayed one after another in a horizontal direction.

    • Vertical Total

      This band is placed at the rightmost position (leftmost when RTL is enabled). You can use the Vertical Total band for report summaries or conclusions.

    Tip

    See Create a Vertical Report for details on how to use vertical bands.
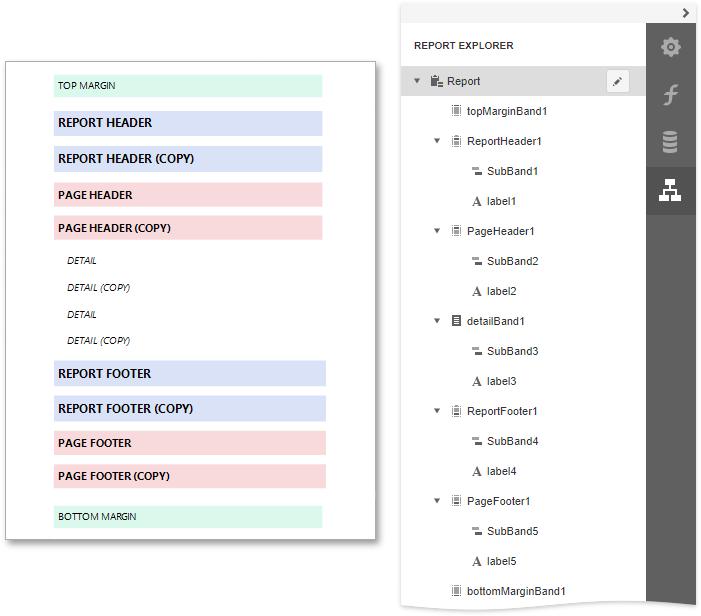
    Create Band Copies

    You can create functional copies of a band, for example, to display different contents based on a specific condition. To do this, add sub-bands to bands.

    Tip

    See Laying out Dynamic Report Contents for details on how to specify the location of bands' content on document pages.

    Manage Report Bands

    Hide Bands in the Report Designer

    Select a band and click on the band's tab title to collapse or expand the band.

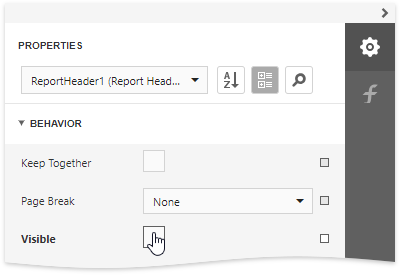
    Hide Bands in the Report Document

    You can avoid printing a band's content in a document. To do this, set the band's Visible property to false. Select the band and set this property in the Properties Panel.

    Remove Bands

    Select a band on the report design surface and press DELETE. This removes the band and all its content.
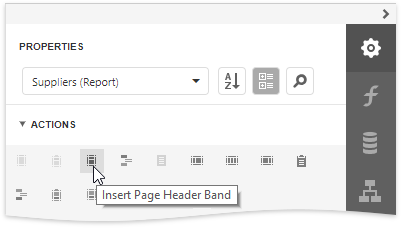
    Add Bands

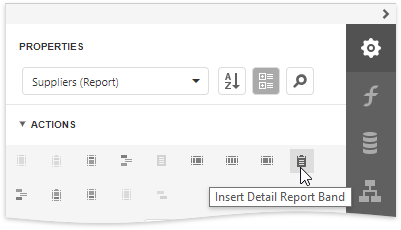
    To add a band, select the report or any of its bands in the Properties panel and click an appropriate item in the Actions category.

    You can insert a detail report band if the report's data source has master-detail relations. Click Insert Detail Report in the Actions category.

    Back to top Copyright © 2020 Metric d.o.o. www.mymetric.net, metric@zg.t-com.hr