• Metric Reports for Web
  • Dashboard for Web

    Show / Hide Table of Contents
    • Report Designer
      • First Look at the Report Designer
      • Add New Reports
      • Open Reports
      • Save Reports
      • Introduction to Banded Reports
      • Bind to Data
        • Bind a Report to a Database
        • Specify Query Parameters
        • Bind a Report to JSON Data
        • Bind a Report to an Object Data Source
        • Data Binding Modes
        • Bind Report Controls to Data (Expression Bindings)
        • Bind Report Controls to Data (Data Bindings)
        • Use Embedded Fields (Mail Merge)
        • Validate Report Data Bindings
      • Create Popular Reports
        • Create a Letter
        • Create a Table Report
        • Create an Invoice Manually
        • Create a Master-Detail Report (Use Detail Report Bands)
        • Create a Master-Detail Report (Use Subreports)
        • Create a Report with PDF Content
        • Create a Hierarchical Report
        • Create a Vertical Report
        • Create Labels and Badges
        • Create a Multi-Column Report
        • Create a Report with Cross-Band Content and Populated Empty Space
        • Create an Interactive E-Form
        • Create a Cross-Tab Report
      • Configure Design Settings
        • Change a Report's Measurement Units
        • Change a Report's Page Settings
        • Enable the Right-To-Left Layout
      • Use Report Elements
        • Manipulate Report Elements
          • Add Controls to a Report
          • Select Report Elements and Access Their Settings
          • Move and Resize Report Elements
          • Apply Styles to Report Elements
          • Copy Report Controls
          • Arrange Report Controls
          • Add Report Controls to Containers
          • Validate the Report Layout
        • Use Basic Report Controls
          • Label
          • Character Comb
          • Rich Text
          • Check Box
          • Picture Box
          • Subreport
          • Panel
          • Page Break
          • Table of Contents
          • Page Info
        • Use Tables
          • Table Overview
          • Bind Table Cells to Data
          • Manage Table Structure
          • Manipulate Table Elements
          • Hide Table Cells
        • Use Bar Codes
          • Add Bar Codes to a Report
          • Bar Code Recognition Specifics
          • Codabar
          • Code 11 (USD-8)
          • Code 128
          • Code 39 (USD-3)
          • Code 39 Extended
          • Code 93
          • Code 93 Extended
          • EAN 13
          • EAN 8
          • ECC200 - Data Matrix
          • GS1 - DataBar
          • GS1- Data Matrix
          • GS1-128 - EAN-128 (UCC)
          • Industrial 2 of 5
          • Intelligent Mail
          • Intelligent Mail Package
          • Interleaved 2 of 5
          • Matrix 2 of 5
          • MSI - Plessey
          • PDF417
          • PostNet
          • QR Code
          • UPC Shipping Container Symbol (ITF-14)
          • UPC Supplemental 2
          • UPC Supplemental 5
          • UPC-A
          • UPC-E0
          • UPC-E1
        • Use Charts and Pivot Grids
          • Use Charts in Reports
          • Add a Chart (Set Up Series Manually)
          • Add a Chart (Use a Series Template)
          • Use Charts to Visualize Grouped Data
          • Link a Chart and a Pivot Grid
        • Use Gauges and Sparklines
          • Add Gauges to a Report
          • Add Sparklines to a Report
        • Draw Lines and Shapes
          • Draw Lines
          • Draw Shapes
          • Draw Cross-Band Lines and Boxes
      • Shape Report Data
        • Filter Data
          • Filter Data at the Report Level
          • Filter Data at the Data Source Level
          • Limit the Number of Records to Display
        • Group and Sort Data
          • Sort Data
          • Group Data
          • Sort Data by a Custom Field
          • Group Data by a Custom Field
          • Sort Groups by a Summary Function's Result
        • Shape Data (Expression Bindings)
          • Format Data
          • Conditionally Change a Control's Appearance
          • Conditionally Change a Label's Text
          • Conditionally Change a Band's Visibility
          • Conditionally Filter Report Data
          • Conditionally Suppress Controls
          • Limit the Number of Records per Page
          • Calculate a Summary
          • Calculate an Advanced Summary
          • Display Row Numbers in a Report, Group or Page
          • Count the Number of Records in a Report or Group
          • Count the Number of Groups in a Report
        • Shape Data (Data Bindings)
          • Format Data
          • Conditionally Change a Control's Appearance
          • Conditionally Change a Label's Text
          • Conditionally Change a Band's Visibility
          • Conditionally Filter Report Data
          • Conditionally Suppress Controls
          • Limit the Number of Records per Page
          • Calculate a Summary
          • Calculate a Custom Summary
          • Display Row Numbers in a Report, Group or Page
          • Count the Number of Records in a Report or Group
          • Count the Number of Groups in a Report
        • Use Calculated Fields
          • Calculated Fields Overview
          • Calculate an Aggregate Function
          • Calculate a Weighted Average Function
        • Use Report Parameters
          • Create a Report Parameter
          • Report Parameters with Predefined Static Values
          • Report Parameters with Predefined Dynamic Values
          • Multi-Value Report Parameters
          • Cascading Report Parameters
          • Date Range Report Parameters
      • Lay out Dynamic Report Content
        • Maintain the Band Location on a Page
        • Keep Content Together
        • Maintain the Size and Content of Data-Bound Controls
        • Anchor Controls
        • Suppress Controls
      • Customize Appearance
        • Appearance Properties
        • Report Visual Styles
      • Add Navigation
        • Add Page Numbers
        • Add Cross-References and Hyperlinks
        • Add Bookmarks and a Document Map
        • Create a Table of Contents
      • Provide Interactivity
        • Create Drill-Down Reports
        • Sort a Report in Print Preview
        • Edit Content in Print Preview
      • Add Extra Information
        • Add Watermarks to a Report
        • Display the Current Date and Time in a Report
        • Display the User Name in a Report
      • Merge Reports
        • Add a Report to the End/Beginning
        • Use Data-Driven Page Sequence
      • Use Expressions
        • Expression Syntax
      • Localize Reports
      • Preview, Print and Export Reports
      • Report Designer Tools
        • Report Wizard
          • Empty Report
          • Table and Vertical Report
            • Select Data Source
            • Specify Data Source Settings (Database)
            • Specify Data Source Settings (JSON)
            • Specify Data Source Settings (Object)
            • Define Report Layout
            • Specify Page Settings
          • Label Report
        • Data Source Wizard
          • Specify Data Source Settings (Database)
          • Specify Data Source Settings (JSON)
          • Specify Data Source Settings (Object)
        • Design Surface
        • Main Menu
        • Main Toolbar
        • Toolbox
        • Query Builder
        • Chart Designer
        • Expression Editor
        • Filter Editor
        • Format String Editor
        • Master-Detail Relation Editor
        • Script Editor
        • Localization Editor
        • UI Panels
          • Properties Panel
          • Expressions Panel
          • Field List
          • Report Explorer
    • Metric Report Manager
      • First look at the report manager
      • End user management
      • Open a report using the Report Manager
      • Add new report to the Report Manager

    Move and Resize Report Elements

    You can use the mouse or keyboard to move a report control to a new location.

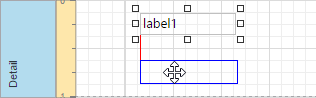
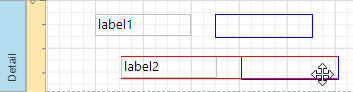
    You can also select multiple controls and move them in the same way as individual report controls.

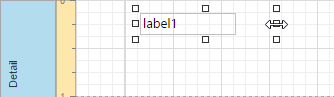
    Select a control and then drag a rectangle drawn on its edge or corner to resize it.

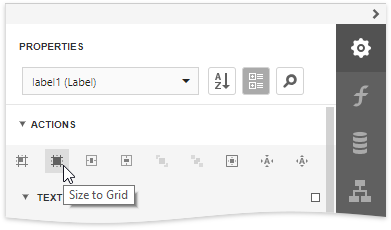
    Use the Size to Grid button to resize a control to the report's Snap Grid.

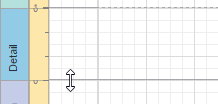
    Drag a band's header strip to resize the band.

    You can also use the Report Explorer to move a control to other bands (except Detail Report Band), or into a Panel or Table Cell controls. Select a control and drag it within the Report Explorer. The drop targets are highlighted when you drag the control over them.

    Note

    You can drag the Table Of Contents only to the Report Header Band and Report Footer Band.

    See Arrange Report Controls for information about tools that help you align report controls to each other and layout edges.

    Back to top Copyright © 2020 Metric d.o.o. www.mymetric.net, metric@zg.t-com.hr