• Metric Reports for Web
  • Dashboard for Web

    Show / Hide Table of Contents
    • Report Designer
      • First Look at the Report Designer
      • Add New Reports
      • Open Reports
      • Save Reports
      • Introduction to Banded Reports
      • Bind to Data
        • Bind a Report to a Database
        • Specify Query Parameters
        • Bind a Report to JSON Data
        • Bind a Report to an Object Data Source
        • Data Binding Modes
        • Bind Report Controls to Data (Expression Bindings)
        • Bind Report Controls to Data (Data Bindings)
        • Use Embedded Fields (Mail Merge)
        • Validate Report Data Bindings
      • Create Popular Reports
        • Create a Letter
        • Create a Table Report
        • Create an Invoice Manually
        • Create a Master-Detail Report (Use Detail Report Bands)
        • Create a Master-Detail Report (Use Subreports)
        • Create a Report with PDF Content
        • Create a Hierarchical Report
        • Create a Vertical Report
        • Create Labels and Badges
        • Create a Multi-Column Report
        • Create a Report with Cross-Band Content and Populated Empty Space
        • Create an Interactive E-Form
        • Create a Cross-Tab Report
      • Configure Design Settings
        • Change a Report's Measurement Units
        • Change a Report's Page Settings
        • Enable the Right-To-Left Layout
      • Use Report Elements
        • Manipulate Report Elements
          • Add Controls to a Report
          • Select Report Elements and Access Their Settings
          • Move and Resize Report Elements
          • Apply Styles to Report Elements
          • Copy Report Controls
          • Arrange Report Controls
          • Add Report Controls to Containers
          • Validate the Report Layout
        • Use Basic Report Controls
          • Label
          • Character Comb
          • Rich Text
          • Check Box
          • Picture Box
          • Subreport
          • Panel
          • Page Break
          • Table of Contents
          • Page Info
        • Use Tables
          • Table Overview
          • Bind Table Cells to Data
          • Manage Table Structure
          • Manipulate Table Elements
          • Hide Table Cells
        • Use Bar Codes
          • Add Bar Codes to a Report
          • Bar Code Recognition Specifics
          • Codabar
          • Code 11 (USD-8)
          • Code 128
          • Code 39 (USD-3)
          • Code 39 Extended
          • Code 93
          • Code 93 Extended
          • EAN 13
          • EAN 8
          • ECC200 - Data Matrix
          • GS1 - DataBar
          • GS1- Data Matrix
          • GS1-128 - EAN-128 (UCC)
          • Industrial 2 of 5
          • Intelligent Mail
          • Intelligent Mail Package
          • Interleaved 2 of 5
          • Matrix 2 of 5
          • MSI - Plessey
          • PDF417
          • PostNet
          • QR Code
          • UPC Shipping Container Symbol (ITF-14)
          • UPC Supplemental 2
          • UPC Supplemental 5
          • UPC-A
          • UPC-E0
          • UPC-E1
        • Use Charts and Pivot Grids
          • Use Charts in Reports
          • Add a Chart (Set Up Series Manually)
          • Add a Chart (Use a Series Template)
          • Use Charts to Visualize Grouped Data
          • Link a Chart and a Pivot Grid
        • Use Gauges and Sparklines
          • Add Gauges to a Report
          • Add Sparklines to a Report
        • Draw Lines and Shapes
          • Draw Lines
          • Draw Shapes
          • Draw Cross-Band Lines and Boxes
      • Shape Report Data
        • Filter Data
          • Filter Data at the Report Level
          • Filter Data at the Data Source Level
          • Limit the Number of Records to Display
        • Group and Sort Data
          • Sort Data
          • Group Data
          • Sort Data by a Custom Field
          • Group Data by a Custom Field
          • Sort Groups by a Summary Function's Result
        • Shape Data (Expression Bindings)
          • Format Data
          • Conditionally Change a Control's Appearance
          • Conditionally Change a Label's Text
          • Conditionally Change a Band's Visibility
          • Conditionally Filter Report Data
          • Conditionally Suppress Controls
          • Limit the Number of Records per Page
          • Calculate a Summary
          • Calculate an Advanced Summary
          • Display Row Numbers in a Report, Group or Page
          • Count the Number of Records in a Report or Group
          • Count the Number of Groups in a Report
        • Shape Data (Data Bindings)
          • Format Data
          • Conditionally Change a Control's Appearance
          • Conditionally Change a Label's Text
          • Conditionally Change a Band's Visibility
          • Conditionally Filter Report Data
          • Conditionally Suppress Controls
          • Limit the Number of Records per Page
          • Calculate a Summary
          • Calculate a Custom Summary
          • Display Row Numbers in a Report, Group or Page
          • Count the Number of Records in a Report or Group
          • Count the Number of Groups in a Report
        • Use Calculated Fields
          • Calculated Fields Overview
          • Calculate an Aggregate Function
          • Calculate a Weighted Average Function
        • Use Report Parameters
          • Create a Report Parameter
          • Report Parameters with Predefined Static Values
          • Report Parameters with Predefined Dynamic Values
          • Multi-Value Report Parameters
          • Cascading Report Parameters
          • Date Range Report Parameters
      • Lay out Dynamic Report Content
        • Maintain the Band Location on a Page
        • Keep Content Together
        • Maintain the Size and Content of Data-Bound Controls
        • Anchor Controls
        • Suppress Controls
      • Customize Appearance
        • Appearance Properties
        • Report Visual Styles
      • Add Navigation
        • Add Page Numbers
        • Add Cross-References and Hyperlinks
        • Add Bookmarks and a Document Map
        • Create a Table of Contents
      • Provide Interactivity
        • Create Drill-Down Reports
        • Sort a Report in Print Preview
        • Edit Content in Print Preview
      • Add Extra Information
        • Add Watermarks to a Report
        • Display the Current Date and Time in a Report
        • Display the User Name in a Report
      • Merge Reports
        • Add a Report to the End/Beginning
        • Use Data-Driven Page Sequence
      • Use Expressions
        • Expression Syntax
      • Localize Reports
      • Preview, Print and Export Reports
      • Report Designer Tools
        • Report Wizard
          • Empty Report
          • Table and Vertical Report
            • Select Data Source
            • Specify Data Source Settings (Database)
            • Specify Data Source Settings (JSON)
            • Specify Data Source Settings (Object)
            • Define Report Layout
            • Specify Page Settings
          • Label Report
        • Data Source Wizard
          • Specify Data Source Settings (Database)
          • Specify Data Source Settings (JSON)
          • Specify Data Source Settings (Object)
        • Design Surface
        • Main Menu
        • Main Toolbar
        • Toolbox
        • Query Builder
        • Chart Designer
        • Expression Editor
        • Filter Editor
        • Format String Editor
        • Master-Detail Relation Editor
        • Script Editor
        • Localization Editor
        • UI Panels
          • Properties Panel
          • Expressions Panel
          • Field List
          • Report Explorer
    • Metric Report Manager
      • First look at the report manager
      • End user management
      • Open a report using the Report Manager
      • Add new report to the Report Manager

    Use Data-Driven Page Sequence

    This topic describes how to combine a table report that uses Portrait page orientation and a chart report that uses Landscape page orientation.

    eurd-merge-reports

    Follow the steps below to create a combined report:

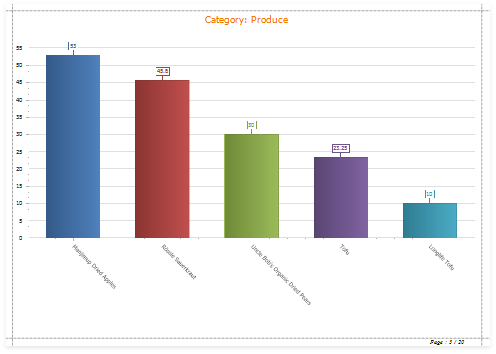
    Create a Chart Report

    1. Create a report that shows data in the chart form. Bind the report to a data source. Set the report's Landscape property to true to enable the Landscape page orientation.

      eurd-merge-chart-report

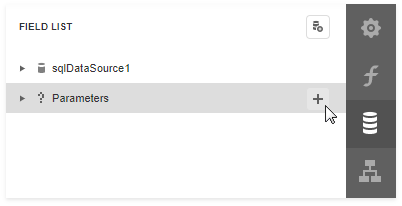
    2. Add a parameter to your chart report to identify which data to use for the chart. Switch to the Field List tab and click the Parameters node's plus button.

      eurd-fieldlist-addparameter

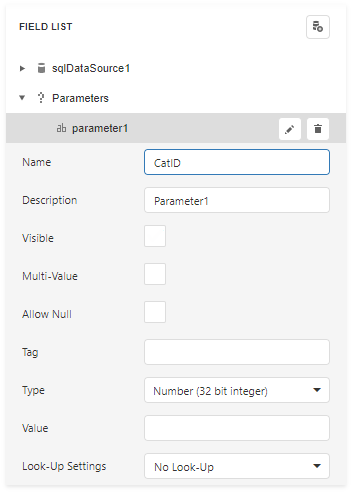
    3. Click the created parameter's edit button and set its Name and Type, and uncheck the Visible option.

      eurd-report-param

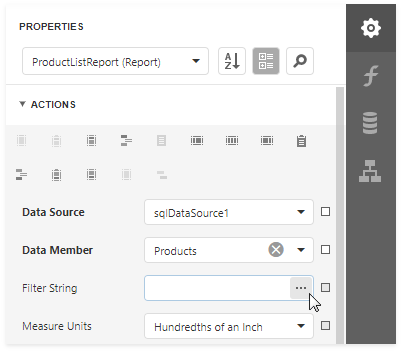
    4. Switch to the report's Properties tab. Click the Filter String option's ellipsis button.

      eurd-report-filterstring

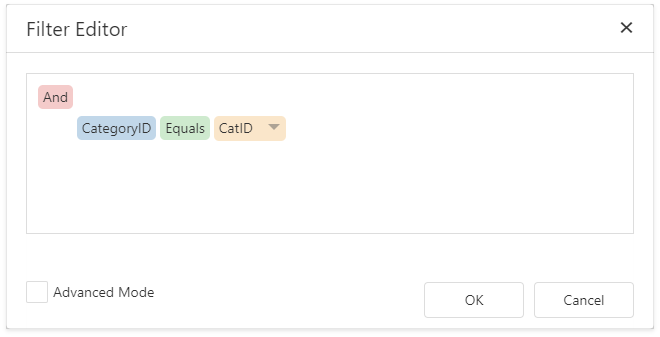
    5. In the Filter Editor dialog, construct an expression to compare the key data field to the created parameter.

      eurd-report-param-2

    6. Save the report.

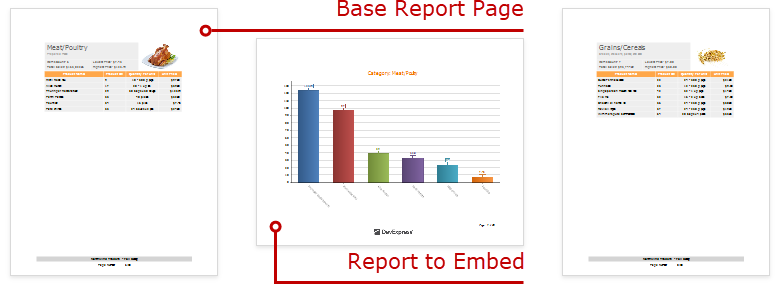
    Create the Base Report

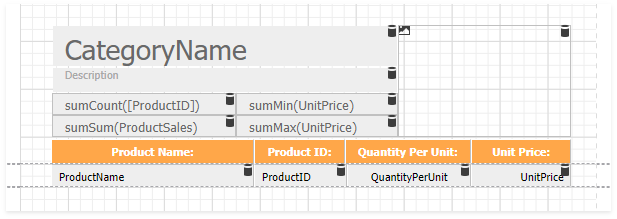
    1. Create a report bound to the same data source as the chart report, and arrange a layout like the one shown below:

      xtrareports-create-report

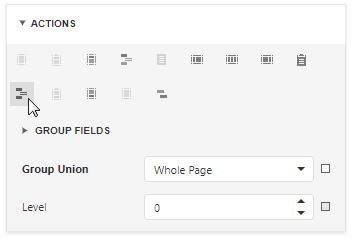
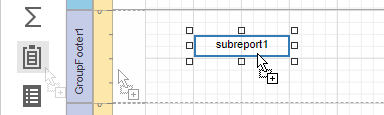
    2. Switch to the Actions tab and click Insert Group Footer.

      eurd-merge-add-group-footer

    3. Drag a Subreport item from the Toolbox onto the added group footer band.

      xtrareports-add-subreport

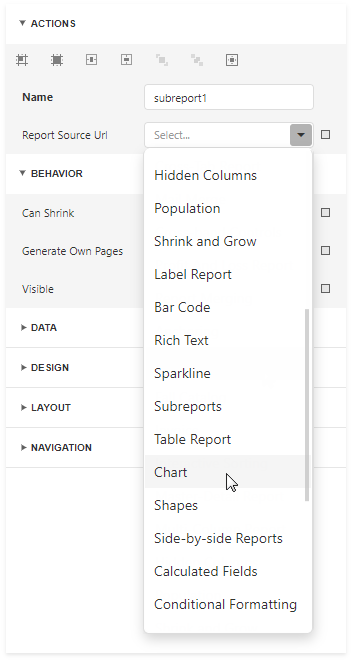
    4. Select the subreport control. In the Actions group, set the Report Source Url parameter to the chart report.

      xtrareports-add-subreport

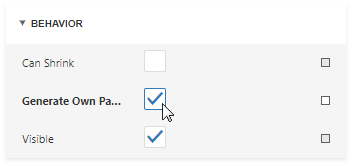
    5. Enable the Generate Own Pages option to print the embedded report on separate pages and use its own page settings.

      xtrareports-subreport-enable-generateownpages

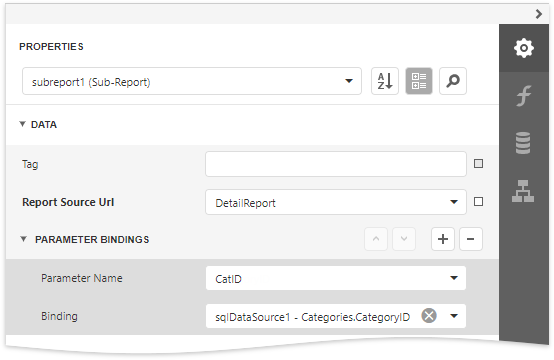
    6. Bind the subreport's parameter used as a filter criterion to the master report's data field that serves as a source of the parameter value. Expand the Data category, select the Parameter Bindings section and add a new parameter binding. In the binding properties list, specify the data field to bind a subreport parameter to, and the parameter you want to bind.

      xtrareports-add-subreport

    7. Switch to Preview mode to see the combined report.

      xtrareports-merge-reports

    Your base report's Table of Contents and Document Map include bookmarks from the embedded report. Use the Parent Bookmark property to specify the nesting level for the embedded report's bookmarks.

    Back to top Copyright © 2020 Metric d.o.o. www.mymetric.net, metric@zg.t-com.hr