• Metric Reports for Web
  • Dashboard for Web

    Show / Hide Table of Contents
    • Report Designer
      • First Look at the Report Designer
      • Add New Reports
      • Open Reports
      • Save Reports
      • Introduction to Banded Reports
      • Bind to Data
        • Bind a Report to a Database
        • Specify Query Parameters
        • Bind a Report to JSON Data
        • Bind a Report to an Object Data Source
        • Data Binding Modes
        • Bind Report Controls to Data (Expression Bindings)
        • Bind Report Controls to Data (Data Bindings)
        • Use Embedded Fields (Mail Merge)
        • Validate Report Data Bindings
      • Create Popular Reports
        • Create a Letter
        • Create a Table Report
        • Create an Invoice Manually
        • Create a Master-Detail Report (Use Detail Report Bands)
        • Create a Master-Detail Report (Use Subreports)
        • Create a Report with PDF Content
        • Create a Hierarchical Report
        • Create a Vertical Report
        • Create Labels and Badges
        • Create a Multi-Column Report
        • Create a Report with Cross-Band Content and Populated Empty Space
        • Create an Interactive E-Form
        • Create a Cross-Tab Report
      • Configure Design Settings
        • Change a Report's Measurement Units
        • Change a Report's Page Settings
        • Enable the Right-To-Left Layout
      • Use Report Elements
        • Manipulate Report Elements
          • Add Controls to a Report
          • Select Report Elements and Access Their Settings
          • Move and Resize Report Elements
          • Apply Styles to Report Elements
          • Copy Report Controls
          • Arrange Report Controls
          • Add Report Controls to Containers
          • Validate the Report Layout
        • Use Basic Report Controls
          • Label
          • Character Comb
          • Rich Text
          • Check Box
          • Picture Box
          • Subreport
          • Panel
          • Page Break
          • Table of Contents
          • Page Info
        • Use Tables
          • Table Overview
          • Bind Table Cells to Data
          • Manage Table Structure
          • Manipulate Table Elements
          • Hide Table Cells
        • Use Bar Codes
          • Add Bar Codes to a Report
          • Bar Code Recognition Specifics
          • Codabar
          • Code 11 (USD-8)
          • Code 128
          • Code 39 (USD-3)
          • Code 39 Extended
          • Code 93
          • Code 93 Extended
          • EAN 13
          • EAN 8
          • ECC200 - Data Matrix
          • GS1 - DataBar
          • GS1- Data Matrix
          • GS1-128 - EAN-128 (UCC)
          • Industrial 2 of 5
          • Intelligent Mail
          • Intelligent Mail Package
          • Interleaved 2 of 5
          • Matrix 2 of 5
          • MSI - Plessey
          • PDF417
          • PostNet
          • QR Code
          • UPC Shipping Container Symbol (ITF-14)
          • UPC Supplemental 2
          • UPC Supplemental 5
          • UPC-A
          • UPC-E0
          • UPC-E1
        • Use Charts and Pivot Grids
          • Use Charts in Reports
          • Add a Chart (Set Up Series Manually)
          • Add a Chart (Use a Series Template)
          • Use Charts to Visualize Grouped Data
          • Link a Chart and a Pivot Grid
        • Use Gauges and Sparklines
          • Add Gauges to a Report
          • Add Sparklines to a Report
        • Draw Lines and Shapes
          • Draw Lines
          • Draw Shapes
          • Draw Cross-Band Lines and Boxes
      • Shape Report Data
        • Filter Data
          • Filter Data at the Report Level
          • Filter Data at the Data Source Level
          • Limit the Number of Records to Display
        • Group and Sort Data
          • Sort Data
          • Group Data
          • Sort Data by a Custom Field
          • Group Data by a Custom Field
          • Sort Groups by a Summary Function's Result
        • Shape Data (Expression Bindings)
          • Format Data
          • Conditionally Change a Control's Appearance
          • Conditionally Change a Label's Text
          • Conditionally Change a Band's Visibility
          • Conditionally Filter Report Data
          • Conditionally Suppress Controls
          • Limit the Number of Records per Page
          • Calculate a Summary
          • Calculate an Advanced Summary
          • Display Row Numbers in a Report, Group or Page
          • Count the Number of Records in a Report or Group
          • Count the Number of Groups in a Report
        • Shape Data (Data Bindings)
          • Format Data
          • Conditionally Change a Control's Appearance
          • Conditionally Change a Label's Text
          • Conditionally Change a Band's Visibility
          • Conditionally Filter Report Data
          • Conditionally Suppress Controls
          • Limit the Number of Records per Page
          • Calculate a Summary
          • Calculate a Custom Summary
          • Display Row Numbers in a Report, Group or Page
          • Count the Number of Records in a Report or Group
          • Count the Number of Groups in a Report
        • Use Calculated Fields
          • Calculated Fields Overview
          • Calculate an Aggregate Function
          • Calculate a Weighted Average Function
        • Use Report Parameters
          • Create a Report Parameter
          • Report Parameters with Predefined Static Values
          • Report Parameters with Predefined Dynamic Values
          • Multi-Value Report Parameters
          • Cascading Report Parameters
          • Date Range Report Parameters
      • Lay out Dynamic Report Content
        • Maintain the Band Location on a Page
        • Keep Content Together
        • Maintain the Size and Content of Data-Bound Controls
        • Anchor Controls
        • Suppress Controls
      • Customize Appearance
        • Appearance Properties
        • Report Visual Styles
      • Add Navigation
        • Add Page Numbers
        • Add Cross-References and Hyperlinks
        • Add Bookmarks and a Document Map
        • Create a Table of Contents
      • Provide Interactivity
        • Create Drill-Down Reports
        • Sort a Report in Print Preview
        • Edit Content in Print Preview
      • Add Extra Information
        • Add Watermarks to a Report
        • Display the Current Date and Time in a Report
        • Display the User Name in a Report
      • Merge Reports
        • Add a Report to the End/Beginning
        • Use Data-Driven Page Sequence
      • Use Expressions
        • Expression Syntax
      • Localize Reports
      • Preview, Print and Export Reports
      • Report Designer Tools
        • Report Wizard
          • Empty Report
          • Table and Vertical Report
            • Select Data Source
            • Specify Data Source Settings (Database)
            • Specify Data Source Settings (JSON)
            • Specify Data Source Settings (Object)
            • Define Report Layout
            • Specify Page Settings
          • Label Report
        • Data Source Wizard
          • Specify Data Source Settings (Database)
          • Specify Data Source Settings (JSON)
          • Specify Data Source Settings (Object)
        • Design Surface
        • Main Menu
        • Main Toolbar
        • Toolbox
        • Query Builder
        • Chart Designer
        • Expression Editor
        • Filter Editor
        • Format String Editor
        • Master-Detail Relation Editor
        • Script Editor
        • Localization Editor
        • UI Panels
          • Properties Panel
          • Expressions Panel
          • Field List
          • Report Explorer
    • Metric Report Manager
      • First look at the report manager
      • End user management
      • Open a report using the Report Manager
      • Add new report to the Report Manager

    Calculated Fields Overview

    Calculated fields are primarily used in data-aware reports when using both standard data binding and mail merge. Calculated fields allow you to pre-process a report's input data, based on a certain expression. So, using calculated fields allows you to apply complex expressions to one or more data fields that are obtained from your report's underlying data source. Moreover, you can both group and sort your report data based on a calculated field's value.

    Calculated Fields Overview

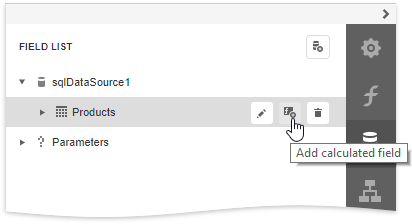
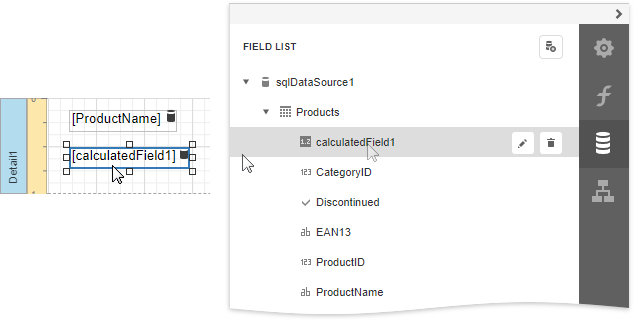
    To create a calculated field, switch to the Field List, select a data table and click Add calculated field.

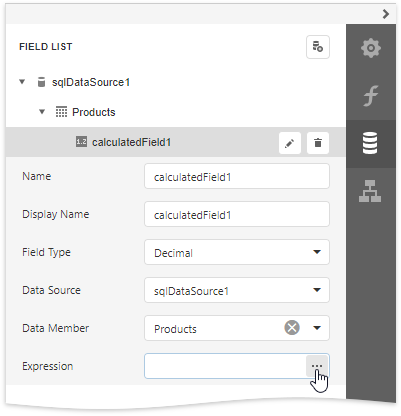
    Click the Edit button for the calculated field to display calculated field properties. Click the Expression property's ellipsis button.

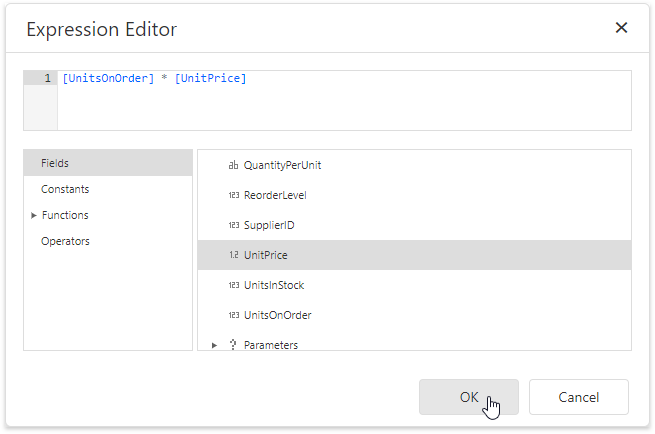
    In the invoked Expression Editor, construct the required expression. You can use data fields, report parameters, predefined constants as well as various date-time, logical, math and string functions. See the next document section for more information about expression syntax.

    Note

    The Expression Editor displays only those data fields that are obtained from a data source specified by the calculated field's Data Source and Data Member property values.

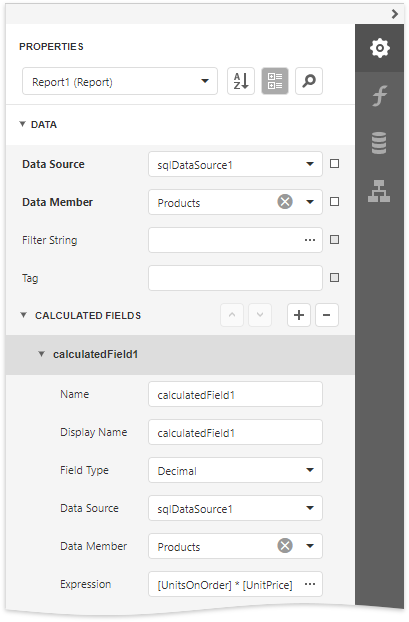
    Switch to the Properties Panel, select the Data category and expand the Calculated Fields section to display the calculated fields collection and manage its items.

    You can drag the calculated field from the Field List onto the required band like an ordinary data field.

    You can also group and sort your report data based on the calculated field values.

    Expression Syntax

    A data field is inserted into the expression's text using its name in [square brackets], and parameters are inserted using the "?" prefix before their names.

    A calculated field's expression can evaluate the values of other calculated fields if you make sure to avoid circular references.

    Date-time constants must be wrapped in hashtags (#) (e.g., [OrderDate] >= #1/1/2009#). To represent a null reference (one that does not refer to any object), use a question mark (e.g., [Region] != ?). To denote strings, use apostrophes ('), otherwise an error will occur.

    To embed an apostrophe into an expression's text, it should be preceded by another apostrophe (e.g., 'It's sample text').

    The type of a value returned by a calculated field is defined by its Field Type property.

    If a calculated field expression involves the use of different types, it is necessary to convert them to the same type (e.g., Max(ToDecimal([Quantity]),[UnitPrice]))

    Although a value that is returned by a calculated field is usually converted to a string (to be displayed in a text-aware report control), it can return a value of any kind. For example, if a database field contains an image, you can set a calculated field's expression to "=...", after which this calculated field can be bound to the Picture Box control.

    To construct a valid aggregate expression, use the following format, which consists of four parts.

    [<Collection>][<Condition>].<Aggregate>(<Expression>)

    • <Collection> - Specifies a collection against which an aggregated value should be calculated. It can be the relationship name in a case of a master-detail relationship, or the name of a collection property exposed by the target class. For example, [CategoriesProducts][[CategoryId]>5].Count(). Empty brackets [] indicate the root collection.
    • <Condition> - Specifies a condition defining which records should participate in calculating an aggregate function. To obtain an aggregated value against all records, delete this logical clause along with square brackets (for example, [].Count()).
    • <Aggregate> - Specifies one of the available aggregate functions.
    • <Expression> - Specifies an expression evaluating values to be used to perform calculation. For example, [][[CategoryID] > 5].Sum([UnitPrice]*[Quantity]). The Count function does not require field values to count the records, so leave the round brackets empty for this function.

    You can refer to the currently processed group using the Parent Relationship Traversal Operator ('^'). This allows you to calculate aggregates within groups using expressions like the following: [][[^.CategoryID] == [CategoryID]].Sum([UnitPrice]).

    For more information, see Expression Syntax.

    Examples

    The following tutorials demonstrate the use of calculated fields in various environments:

    • Calculate an Aggregate Function
    • Calculate a Weighted Average Function
    • Sort Data by a Custom Field
    • Group Data by a Custom Field
    Back to top Copyright © 2020 Metric d.o.o. www.mymetric.net, metric@zg.t-com.hr