• Metric Reports for Web
  • Dashboard for Web

    Show / Hide Table of Contents
    • Report Designer
      • First Look at the Report Designer
      • Add New Reports
      • Open Reports
      • Save Reports
      • Introduction to Banded Reports
      • Bind to Data
        • Bind a Report to a Database
        • Specify Query Parameters
        • Bind a Report to JSON Data
        • Bind a Report to an Object Data Source
        • Data Binding Modes
        • Bind Report Controls to Data (Expression Bindings)
        • Bind Report Controls to Data (Data Bindings)
        • Use Embedded Fields (Mail Merge)
        • Validate Report Data Bindings
      • Create Popular Reports
        • Create a Letter
        • Create a Table Report
        • Create an Invoice Manually
        • Create a Master-Detail Report (Use Detail Report Bands)
        • Create a Master-Detail Report (Use Subreports)
        • Create a Report with PDF Content
        • Create a Hierarchical Report
        • Create a Vertical Report
        • Create Labels and Badges
        • Create a Multi-Column Report
        • Create a Report with Cross-Band Content and Populated Empty Space
        • Create an Interactive E-Form
        • Create a Cross-Tab Report
      • Configure Design Settings
        • Change a Report's Measurement Units
        • Change a Report's Page Settings
        • Enable the Right-To-Left Layout
      • Use Report Elements
        • Manipulate Report Elements
          • Add Controls to a Report
          • Select Report Elements and Access Their Settings
          • Move and Resize Report Elements
          • Apply Styles to Report Elements
          • Copy Report Controls
          • Arrange Report Controls
          • Add Report Controls to Containers
          • Validate the Report Layout
        • Use Basic Report Controls
          • Label
          • Character Comb
          • Rich Text
          • Check Box
          • Picture Box
          • Subreport
          • Panel
          • Page Break
          • Table of Contents
          • Page Info
        • Use Tables
          • Table Overview
          • Bind Table Cells to Data
          • Manage Table Structure
          • Manipulate Table Elements
          • Hide Table Cells
        • Use Bar Codes
          • Add Bar Codes to a Report
          • Bar Code Recognition Specifics
          • Codabar
          • Code 11 (USD-8)
          • Code 128
          • Code 39 (USD-3)
          • Code 39 Extended
          • Code 93
          • Code 93 Extended
          • EAN 13
          • EAN 8
          • ECC200 - Data Matrix
          • GS1 - DataBar
          • GS1- Data Matrix
          • GS1-128 - EAN-128 (UCC)
          • Industrial 2 of 5
          • Intelligent Mail
          • Intelligent Mail Package
          • Interleaved 2 of 5
          • Matrix 2 of 5
          • MSI - Plessey
          • PDF417
          • PostNet
          • QR Code
          • UPC Shipping Container Symbol (ITF-14)
          • UPC Supplemental 2
          • UPC Supplemental 5
          • UPC-A
          • UPC-E0
          • UPC-E1
        • Use Charts and Pivot Grids
          • Use Charts in Reports
          • Add a Chart (Set Up Series Manually)
          • Add a Chart (Use a Series Template)
          • Use Charts to Visualize Grouped Data
          • Link a Chart and a Pivot Grid
        • Use Gauges and Sparklines
          • Add Gauges to a Report
          • Add Sparklines to a Report
        • Draw Lines and Shapes
          • Draw Lines
          • Draw Shapes
          • Draw Cross-Band Lines and Boxes
      • Shape Report Data
        • Filter Data
          • Filter Data at the Report Level
          • Filter Data at the Data Source Level
          • Limit the Number of Records to Display
        • Group and Sort Data
          • Sort Data
          • Group Data
          • Sort Data by a Custom Field
          • Group Data by a Custom Field
          • Sort Groups by a Summary Function's Result
        • Shape Data (Expression Bindings)
          • Format Data
          • Conditionally Change a Control's Appearance
          • Conditionally Change a Label's Text
          • Conditionally Change a Band's Visibility
          • Conditionally Filter Report Data
          • Conditionally Suppress Controls
          • Limit the Number of Records per Page
          • Calculate a Summary
          • Calculate an Advanced Summary
          • Display Row Numbers in a Report, Group or Page
          • Count the Number of Records in a Report or Group
          • Count the Number of Groups in a Report
        • Shape Data (Data Bindings)
          • Format Data
          • Conditionally Change a Control's Appearance
          • Conditionally Change a Label's Text
          • Conditionally Change a Band's Visibility
          • Conditionally Filter Report Data
          • Conditionally Suppress Controls
          • Limit the Number of Records per Page
          • Calculate a Summary
          • Calculate a Custom Summary
          • Display Row Numbers in a Report, Group or Page
          • Count the Number of Records in a Report or Group
          • Count the Number of Groups in a Report
        • Use Calculated Fields
          • Calculated Fields Overview
          • Calculate an Aggregate Function
          • Calculate a Weighted Average Function
        • Use Report Parameters
          • Create a Report Parameter
          • Report Parameters with Predefined Static Values
          • Report Parameters with Predefined Dynamic Values
          • Multi-Value Report Parameters
          • Cascading Report Parameters
          • Date Range Report Parameters
      • Lay out Dynamic Report Content
        • Maintain the Band Location on a Page
        • Keep Content Together
        • Maintain the Size and Content of Data-Bound Controls
        • Anchor Controls
        • Suppress Controls
      • Customize Appearance
        • Appearance Properties
        • Report Visual Styles
      • Add Navigation
        • Add Page Numbers
        • Add Cross-References and Hyperlinks
        • Add Bookmarks and a Document Map
        • Create a Table of Contents
      • Provide Interactivity
        • Create Drill-Down Reports
        • Sort a Report in Print Preview
        • Edit Content in Print Preview
      • Add Extra Information
        • Add Watermarks to a Report
        • Display the Current Date and Time in a Report
        • Display the User Name in a Report
      • Merge Reports
        • Add a Report to the End/Beginning
        • Use Data-Driven Page Sequence
      • Use Expressions
        • Expression Syntax
      • Localize Reports
      • Preview, Print and Export Reports
      • Report Designer Tools
        • Report Wizard
          • Empty Report
          • Table and Vertical Report
            • Select Data Source
            • Specify Data Source Settings (Database)
            • Specify Data Source Settings (JSON)
            • Specify Data Source Settings (Object)
            • Define Report Layout
            • Specify Page Settings
          • Label Report
        • Data Source Wizard
          • Specify Data Source Settings (Database)
          • Specify Data Source Settings (JSON)
          • Specify Data Source Settings (Object)
        • Design Surface
        • Main Menu
        • Main Toolbar
        • Toolbox
        • Query Builder
        • Chart Designer
        • Expression Editor
        • Filter Editor
        • Format String Editor
        • Master-Detail Relation Editor
        • Script Editor
        • Localization Editor
        • UI Panels
          • Properties Panel
          • Expressions Panel
          • Field List
          • Report Explorer
    • Metric Report Manager
      • First look at the report manager
      • End user management
      • Open a report using the Report Manager
      • Add new report to the Report Manager

    Define Report Layout

    On this page, you can specify options to generate the report layout.
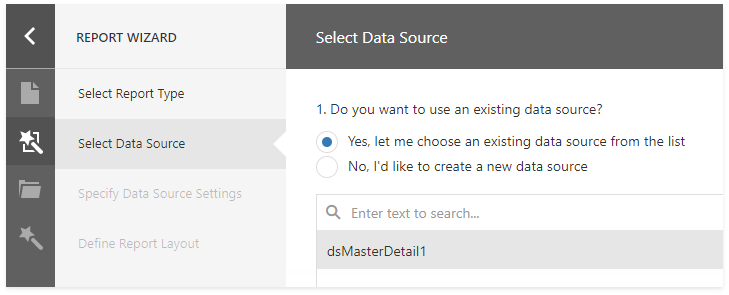
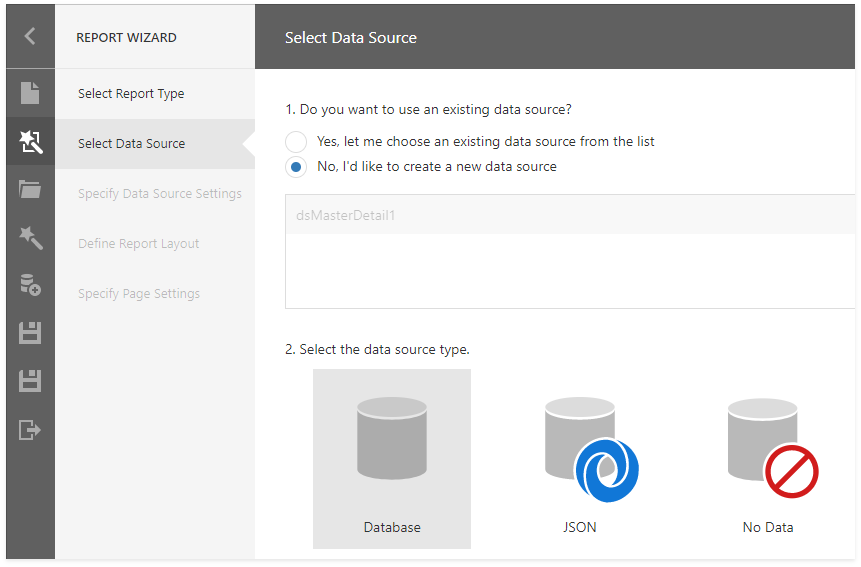
    Select Queries

    Select queries for the report and its detail reports. If you selected the Table Report and bound it to a database, the query list can also contain master-detail relationships.

    **Table Report**

    **Vertical Report**

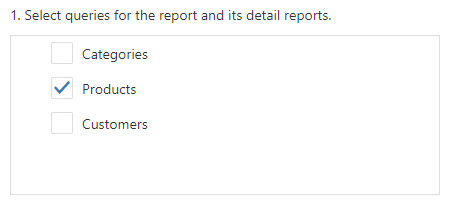
    • If you select one query, the wizard assigns it to the report's DataMember property.
    • If you select two or more queries, the wizard creates the Detail Report Band for each query at the same hierarchical level and assigns the band's DataMember property to the corresponding query.
    • If you select a master-detail relationship, the wizard creates the Detail Report Band under the corresponding master report and assigns the band's DataMember property to this relationship's name.

    Select Data Fields

    Choose data fields from the selected queries to display them in the report.

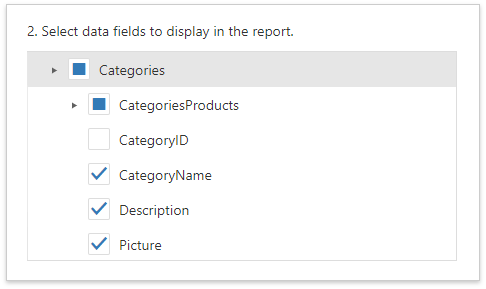
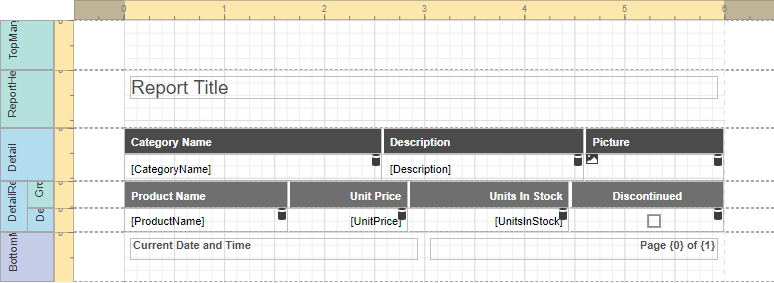
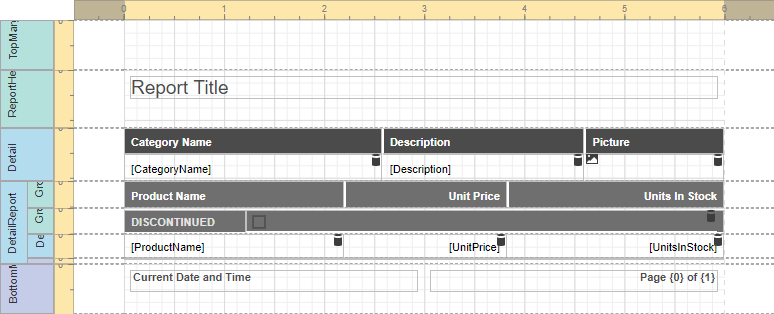
    Click Finish if you do not need to group fields and/or display summaries. The created report looks similar to the image below.

    **Table Report**

    **Vertical Report**

    Add Group Fields

    Click the Add Group button and select data fields in the drop-down list.

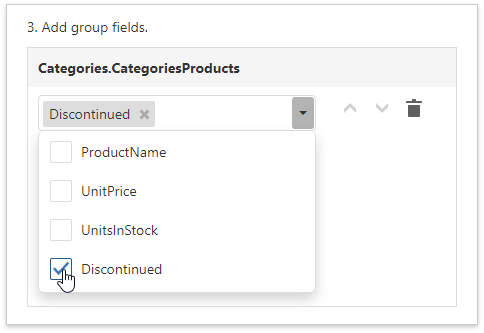
    Use arrow buttons to change the group order.

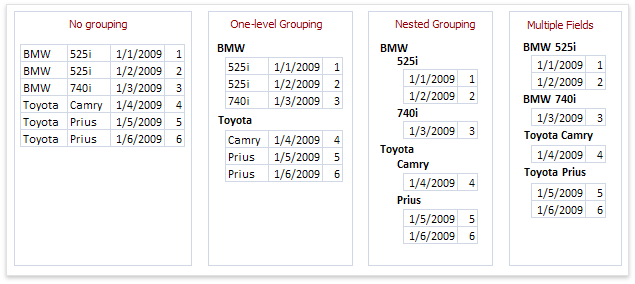
    The following image demonstrates group types:

    Reports-GroupingConcept

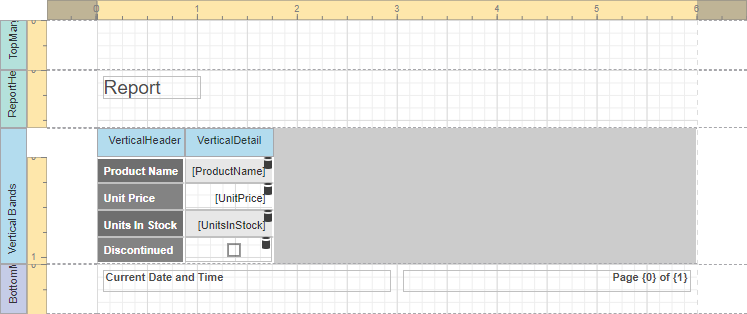
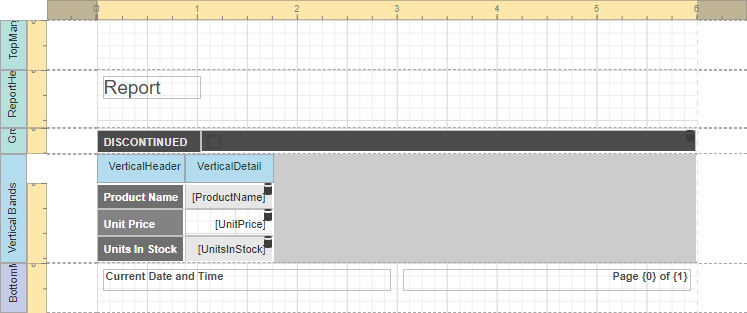
    You can stop the wizard at this step and get the report layout similar to the image below.
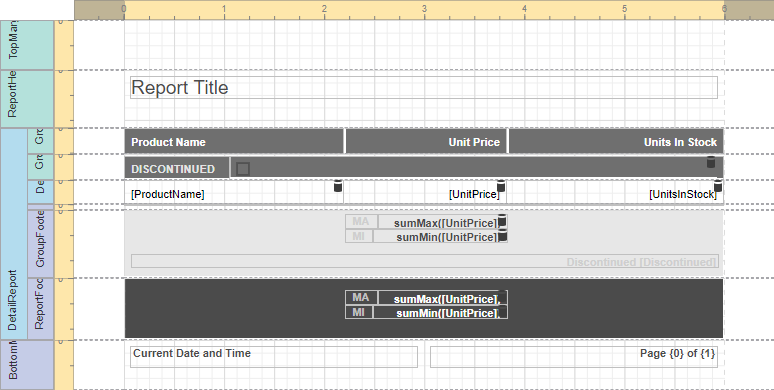
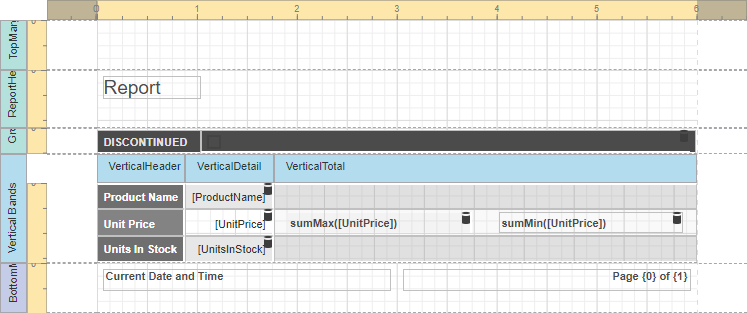
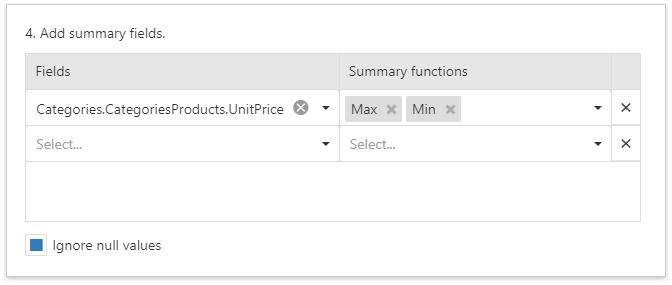
    **Table Report**

    **Vertical Report**

    Add Summary Fields

    To add a summary, select a data field (numeric, date-time or Boolean) and summary function(s).

    • Table Reports display summaries in the Report Footer an Group Footers.
    • Vertical Reports display summaries in the Vertical Total band.

    Select the Ignore null values checkbox to do not take data fields' empty values into account. Otherwise, these values are treated as zeros for numeric and Boolean fields and the earliest system date is used for date-time fields.

    **Table Report**

    **Vertical Report**

    Back to top Copyright © 2020 Metric d.o.o. www.mymetric.net, metric@zg.t-com.hr