• Metric Reports for Web
  • Dashboard for Web

    Show / Hide Table of Contents
    • Report Designer
      • First Look at the Report Designer
      • Add New Reports
      • Open Reports
      • Save Reports
      • Introduction to Banded Reports
      • Bind to Data
        • Bind a Report to a Database
        • Specify Query Parameters
        • Bind a Report to JSON Data
        • Bind a Report to an Object Data Source
        • Data Binding Modes
        • Bind Report Controls to Data (Expression Bindings)
        • Bind Report Controls to Data (Data Bindings)
        • Use Embedded Fields (Mail Merge)
        • Validate Report Data Bindings
      • Create Popular Reports
        • Create a Letter
        • Create a Table Report
        • Create an Invoice Manually
        • Create a Master-Detail Report (Use Detail Report Bands)
        • Create a Master-Detail Report (Use Subreports)
        • Create a Report with PDF Content
        • Create a Hierarchical Report
        • Create a Vertical Report
        • Create Labels and Badges
        • Create a Multi-Column Report
        • Create a Report with Cross-Band Content and Populated Empty Space
        • Create an Interactive E-Form
        • Create a Cross-Tab Report
      • Configure Design Settings
        • Change a Report's Measurement Units
        • Change a Report's Page Settings
        • Enable the Right-To-Left Layout
      • Use Report Elements
        • Manipulate Report Elements
          • Add Controls to a Report
          • Select Report Elements and Access Their Settings
          • Move and Resize Report Elements
          • Apply Styles to Report Elements
          • Copy Report Controls
          • Arrange Report Controls
          • Add Report Controls to Containers
          • Validate the Report Layout
        • Use Basic Report Controls
          • Label
          • Character Comb
          • Rich Text
          • Check Box
          • Picture Box
          • Subreport
          • Panel
          • Page Break
          • Table of Contents
          • Page Info
        • Use Tables
          • Table Overview
          • Bind Table Cells to Data
          • Manage Table Structure
          • Manipulate Table Elements
          • Hide Table Cells
        • Use Bar Codes
          • Add Bar Codes to a Report
          • Bar Code Recognition Specifics
          • Codabar
          • Code 11 (USD-8)
          • Code 128
          • Code 39 (USD-3)
          • Code 39 Extended
          • Code 93
          • Code 93 Extended
          • EAN 13
          • EAN 8
          • ECC200 - Data Matrix
          • GS1 - DataBar
          • GS1- Data Matrix
          • GS1-128 - EAN-128 (UCC)
          • Industrial 2 of 5
          • Intelligent Mail
          • Intelligent Mail Package
          • Interleaved 2 of 5
          • Matrix 2 of 5
          • MSI - Plessey
          • PDF417
          • PostNet
          • QR Code
          • UPC Shipping Container Symbol (ITF-14)
          • UPC Supplemental 2
          • UPC Supplemental 5
          • UPC-A
          • UPC-E0
          • UPC-E1
        • Use Charts and Pivot Grids
          • Use Charts in Reports
          • Add a Chart (Set Up Series Manually)
          • Add a Chart (Use a Series Template)
          • Use Charts to Visualize Grouped Data
          • Link a Chart and a Pivot Grid
        • Use Gauges and Sparklines
          • Add Gauges to a Report
          • Add Sparklines to a Report
        • Draw Lines and Shapes
          • Draw Lines
          • Draw Shapes
          • Draw Cross-Band Lines and Boxes
      • Shape Report Data
        • Filter Data
          • Filter Data at the Report Level
          • Filter Data at the Data Source Level
          • Limit the Number of Records to Display
        • Group and Sort Data
          • Sort Data
          • Group Data
          • Sort Data by a Custom Field
          • Group Data by a Custom Field
          • Sort Groups by a Summary Function's Result
        • Shape Data (Expression Bindings)
          • Format Data
          • Conditionally Change a Control's Appearance
          • Conditionally Change a Label's Text
          • Conditionally Change a Band's Visibility
          • Conditionally Filter Report Data
          • Conditionally Suppress Controls
          • Limit the Number of Records per Page
          • Calculate a Summary
          • Calculate an Advanced Summary
          • Display Row Numbers in a Report, Group or Page
          • Count the Number of Records in a Report or Group
          • Count the Number of Groups in a Report
        • Shape Data (Data Bindings)
          • Format Data
          • Conditionally Change a Control's Appearance
          • Conditionally Change a Label's Text
          • Conditionally Change a Band's Visibility
          • Conditionally Filter Report Data
          • Conditionally Suppress Controls
          • Limit the Number of Records per Page
          • Calculate a Summary
          • Calculate a Custom Summary
          • Display Row Numbers in a Report, Group or Page
          • Count the Number of Records in a Report or Group
          • Count the Number of Groups in a Report
        • Use Calculated Fields
          • Calculated Fields Overview
          • Calculate an Aggregate Function
          • Calculate a Weighted Average Function
        • Use Report Parameters
          • Create a Report Parameter
          • Report Parameters with Predefined Static Values
          • Report Parameters with Predefined Dynamic Values
          • Multi-Value Report Parameters
          • Cascading Report Parameters
          • Date Range Report Parameters
      • Lay out Dynamic Report Content
        • Maintain the Band Location on a Page
        • Keep Content Together
        • Maintain the Size and Content of Data-Bound Controls
        • Anchor Controls
        • Suppress Controls
      • Customize Appearance
        • Appearance Properties
        • Report Visual Styles
      • Add Navigation
        • Add Page Numbers
        • Add Cross-References and Hyperlinks
        • Add Bookmarks and a Document Map
        • Create a Table of Contents
      • Provide Interactivity
        • Create Drill-Down Reports
        • Sort a Report in Print Preview
        • Edit Content in Print Preview
      • Add Extra Information
        • Add Watermarks to a Report
        • Display the Current Date and Time in a Report
        • Display the User Name in a Report
      • Merge Reports
        • Add a Report to the End/Beginning
        • Use Data-Driven Page Sequence
      • Use Expressions
        • Expression Syntax
      • Localize Reports
      • Preview, Print and Export Reports
      • Report Designer Tools
        • Report Wizard
          • Empty Report
          • Table and Vertical Report
            • Select Data Source
            • Specify Data Source Settings (Database)
            • Specify Data Source Settings (JSON)
            • Specify Data Source Settings (Object)
            • Define Report Layout
            • Specify Page Settings
          • Label Report
        • Data Source Wizard
          • Specify Data Source Settings (Database)
          • Specify Data Source Settings (JSON)
          • Specify Data Source Settings (Object)
        • Design Surface
        • Main Menu
        • Main Toolbar
        • Toolbox
        • Query Builder
        • Chart Designer
        • Expression Editor
        • Filter Editor
        • Format String Editor
        • Master-Detail Relation Editor
        • Script Editor
        • Localization Editor
        • UI Panels
          • Properties Panel
          • Expressions Panel
          • Field List
          • Report Explorer
    • Metric Report Manager
      • First look at the report manager
      • End user management
      • Open a report using the Report Manager
      • Add new report to the Report Manager

    Rich Text

    Overview

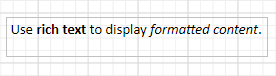
    The Rich Text control displays formatted text (static, dynamic or mixed) in a report.

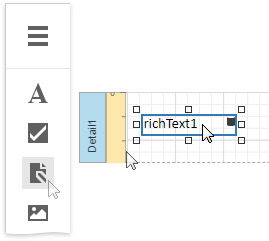
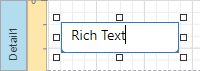
    To add this control to a report, drag the Rich Text item from the Toolbox onto the report's Design Surface.

    Load Content from a File

    You can load RTF or HTML content from an external file. Expand the Data category and click the Load file property's ellipsis button.

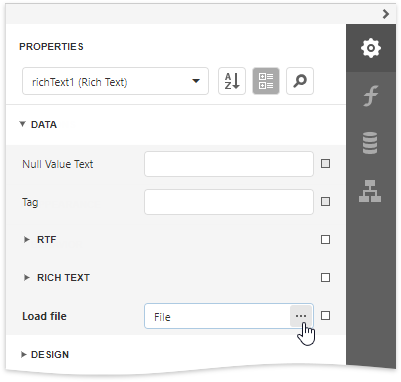
    In the invoked Open dialog, select the file and click Open.

    Rich Text supports the following file formats:

    • RTF
    • DOCX
    • TXT
    • HTML

    Edit Content in Place

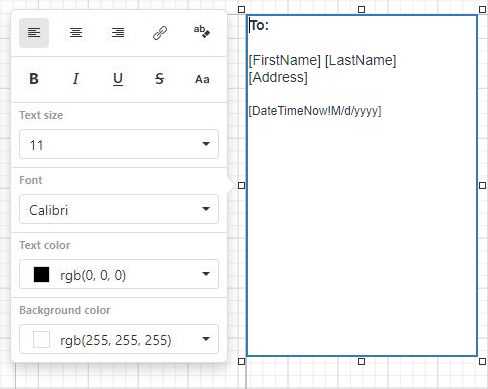
    Double-click a Rich Text control and type text in the invoked in-place editor. A ribbon with text format options appears next to the editor.

    Rich Text supports the following edit operations:

    • Undo/Redo History

      The undo/redo history contains the last 100 operations and is available until you exit the in-place edit mode.

    • Clipboard Operations

      You can use clipboard operations (Cut, Copy, and Paste) to manipulate text and images.

    • Hyperlinks

      You can create and modify hyperlinks.

    • Drag and Drop

      Use Drag and Drop to move images and text within the editor.

    Note

    The legacy Rich Text does not provide a ribbon with text format options. Its in-place editor allows you to enter only plain text. Bind the control to a data field that provides RTF or HTML content to display formatted text.

    Bind to Data

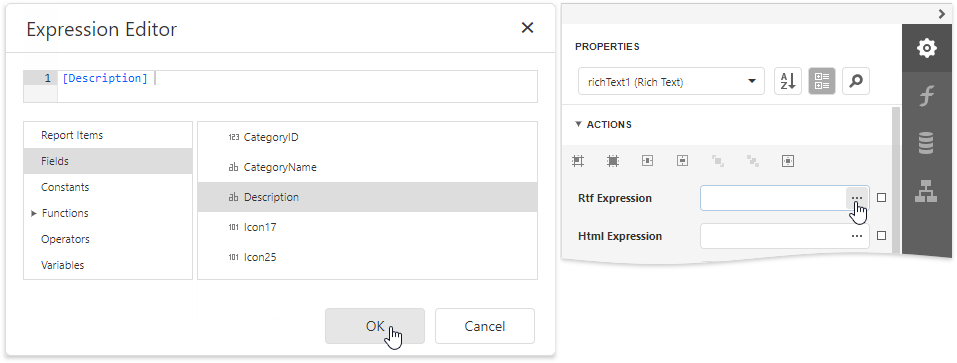
    Click the Rtf Expression or Html Expression option's ellipsis button to invoke the Expression Editor. Use this editor to bind the control to a data field or construct a complex binding expression with two or more data fields.

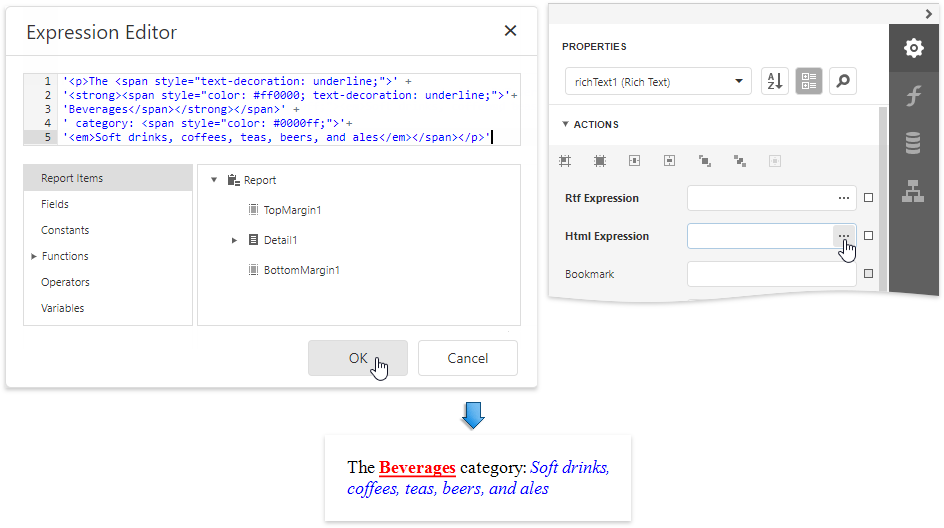
    You can use HTML formatted text that contains markup tags to define text appearance. Click the Html Expression option's ellipsis button and enter this text in ' quotes ' in the invoked Expression Editor.

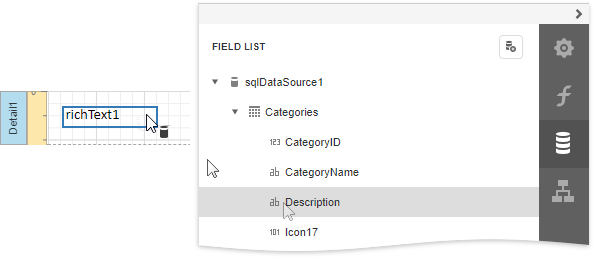
    Drag and drop a numeric or text field from the Field List onto the Rich Text control to bind it to this field.

    The Rich Text also enables you to merge data fields and static content in its text.

    See the Bind Controls to Data and Use Embedded Fields topics for more information.

    Markup Text

    Supported Tags

    The table below lists the supported HTML tags. External links are processed for inline pictures and style sheets (CSS files). The ID and Class attributes are interpreted for all tags, including the unlisted ones. These attributes are used to specify a style for content within a certain tag

    Tag Attributes Notes
    a dir
    b dir
    base
    basefont size
    color
    face
    dir
    big dir
    blockquote dir
    br dir
    center dir
    code dir
    del cite
    datetime
    div page-break-before
    page-break-after
    page-break-inside
    background-color
    border (CSS)
    dir
    Only the always property value is supported for the page-break-before tag.
    em dir
    font size
    color
    face
    dir
    h1-h6 align
    dir
    head
    html
    hr align
    color
    noshade
    size
    width
    i dir
    ins cite
    datetime
    img align
    src
    height
    width
    If the align attribute is not specified, the image is considered as inline.
    li type
    value
    dir
    link href
    type
    media
    dir
    meta
    ol type
    value
    align
    dir
    p align
    dir
    script Text inside this tag is ignored.
    small
    span
    strike dir
    strong dir
    style
    sub dir
    sup dir
    table align
    bgcolor
    border
    bordercolor
    cellpadding
    cellspacing
    dir
    width
    The dir attribute reorders table columns.
    td align
    bgcolor
    bordercolor
    colspan
    height
    nowrap
    rowspan
    text-align
    valign
    width
    The align tag is supported in the Internet Explorer only.
    The Rich Text control's interpretation of the bordercolor attribute is different from the HTML browser.
    th any allowed
    tr align
    bgcolor
    bordercolor
    height
    text-align
    valign
    The align attribute is supported in the Internet Explorer only.
    title Text inside this tag is ignored.
    u dir
    ul dir

    Unsupported Tags

    • <base> tag with href attribute;
    • <div> tag with border, align and float CSS attribute;
    • <li> tag with list-style-image CSS attribute;
    • <margin> tag;
    • <tab> tag;
    • <table> tag with cols attribute;
    • <td> tab with bordercolor and nowrap attributes;
    • !important declaration;
    • word-wrap and break-word css properties;
    • css3 shapes;
    • <ui> tag with type attribute.

    Export to Excel

    When a report is exported to XLS or XLSX, the following rich-text content is converted from Rich Text controls into Excel-native rich-text content:

    HTML Tags and RTF Equivalents
    Text format <b>, <i>, <u>, <s>, <strong>, <em>
    Line break <br>
    Non-breaking space &nbsp;
    Font <font face=[font name]>
    Font size <font size=[font size]>
    Foreground color <font color=[color]>
    Back to top Copyright © 2020 Metric d.o.o. www.mymetric.net, metric@zg.t-com.hr