• Metric Reports for Web
  • Dashboard for Web

    Show / Hide Table of Contents
    • Report Designer
      • First Look at the Report Designer
      • Add New Reports
      • Open Reports
      • Save Reports
      • Introduction to Banded Reports
      • Bind to Data
        • Bind a Report to a Database
        • Specify Query Parameters
        • Bind a Report to JSON Data
        • Bind a Report to an Object Data Source
        • Data Binding Modes
        • Bind Report Controls to Data (Expression Bindings)
        • Bind Report Controls to Data (Data Bindings)
        • Use Embedded Fields (Mail Merge)
        • Validate Report Data Bindings
      • Create Popular Reports
        • Create a Letter
        • Create a Table Report
        • Create an Invoice Manually
        • Create a Master-Detail Report (Use Detail Report Bands)
        • Create a Master-Detail Report (Use Subreports)
        • Create a Report with PDF Content
        • Create a Hierarchical Report
        • Create a Vertical Report
        • Create Labels and Badges
        • Create a Multi-Column Report
        • Create a Report with Cross-Band Content and Populated Empty Space
        • Create an Interactive E-Form
        • Create a Cross-Tab Report
      • Configure Design Settings
        • Change a Report's Measurement Units
        • Change a Report's Page Settings
        • Enable the Right-To-Left Layout
      • Use Report Elements
        • Manipulate Report Elements
          • Add Controls to a Report
          • Select Report Elements and Access Their Settings
          • Move and Resize Report Elements
          • Apply Styles to Report Elements
          • Copy Report Controls
          • Arrange Report Controls
          • Add Report Controls to Containers
          • Validate the Report Layout
        • Use Basic Report Controls
          • Label
          • Character Comb
          • Rich Text
          • Check Box
          • Picture Box
          • Subreport
          • Panel
          • Page Break
          • Table of Contents
          • Page Info
        • Use Tables
          • Table Overview
          • Bind Table Cells to Data
          • Manage Table Structure
          • Manipulate Table Elements
          • Hide Table Cells
        • Use Bar Codes
          • Add Bar Codes to a Report
          • Bar Code Recognition Specifics
          • Codabar
          • Code 11 (USD-8)
          • Code 128
          • Code 39 (USD-3)
          • Code 39 Extended
          • Code 93
          • Code 93 Extended
          • EAN 13
          • EAN 8
          • ECC200 - Data Matrix
          • GS1 - DataBar
          • GS1- Data Matrix
          • GS1-128 - EAN-128 (UCC)
          • Industrial 2 of 5
          • Intelligent Mail
          • Intelligent Mail Package
          • Interleaved 2 of 5
          • Matrix 2 of 5
          • MSI - Plessey
          • PDF417
          • PostNet
          • QR Code
          • UPC Shipping Container Symbol (ITF-14)
          • UPC Supplemental 2
          • UPC Supplemental 5
          • UPC-A
          • UPC-E0
          • UPC-E1
        • Use Charts and Pivot Grids
          • Use Charts in Reports
          • Add a Chart (Set Up Series Manually)
          • Add a Chart (Use a Series Template)
          • Use Charts to Visualize Grouped Data
          • Link a Chart and a Pivot Grid
        • Use Gauges and Sparklines
          • Add Gauges to a Report
          • Add Sparklines to a Report
        • Draw Lines and Shapes
          • Draw Lines
          • Draw Shapes
          • Draw Cross-Band Lines and Boxes
      • Shape Report Data
        • Filter Data
          • Filter Data at the Report Level
          • Filter Data at the Data Source Level
          • Limit the Number of Records to Display
        • Group and Sort Data
          • Sort Data
          • Group Data
          • Sort Data by a Custom Field
          • Group Data by a Custom Field
          • Sort Groups by a Summary Function's Result
        • Shape Data (Expression Bindings)
          • Format Data
          • Conditionally Change a Control's Appearance
          • Conditionally Change a Label's Text
          • Conditionally Change a Band's Visibility
          • Conditionally Filter Report Data
          • Conditionally Suppress Controls
          • Limit the Number of Records per Page
          • Calculate a Summary
          • Calculate an Advanced Summary
          • Display Row Numbers in a Report, Group or Page
          • Count the Number of Records in a Report or Group
          • Count the Number of Groups in a Report
        • Shape Data (Data Bindings)
          • Format Data
          • Conditionally Change a Control's Appearance
          • Conditionally Change a Label's Text
          • Conditionally Change a Band's Visibility
          • Conditionally Filter Report Data
          • Conditionally Suppress Controls
          • Limit the Number of Records per Page
          • Calculate a Summary
          • Calculate a Custom Summary
          • Display Row Numbers in a Report, Group or Page
          • Count the Number of Records in a Report or Group
          • Count the Number of Groups in a Report
        • Use Calculated Fields
          • Calculated Fields Overview
          • Calculate an Aggregate Function
          • Calculate a Weighted Average Function
        • Use Report Parameters
          • Create a Report Parameter
          • Report Parameters with Predefined Static Values
          • Report Parameters with Predefined Dynamic Values
          • Multi-Value Report Parameters
          • Cascading Report Parameters
          • Date Range Report Parameters
      • Lay out Dynamic Report Content
        • Maintain the Band Location on a Page
        • Keep Content Together
        • Maintain the Size and Content of Data-Bound Controls
        • Anchor Controls
        • Suppress Controls
      • Customize Appearance
        • Appearance Properties
        • Report Visual Styles
      • Add Navigation
        • Add Page Numbers
        • Add Cross-References and Hyperlinks
        • Add Bookmarks and a Document Map
        • Create a Table of Contents
      • Provide Interactivity
        • Create Drill-Down Reports
        • Sort a Report in Print Preview
        • Edit Content in Print Preview
      • Add Extra Information
        • Add Watermarks to a Report
        • Display the Current Date and Time in a Report
        • Display the User Name in a Report
      • Merge Reports
        • Add a Report to the End/Beginning
        • Use Data-Driven Page Sequence
      • Use Expressions
        • Expression Syntax
      • Localize Reports
      • Preview, Print and Export Reports
      • Report Designer Tools
        • Report Wizard
          • Empty Report
          • Table and Vertical Report
            • Select Data Source
            • Specify Data Source Settings (Database)
            • Specify Data Source Settings (JSON)
            • Specify Data Source Settings (Object)
            • Define Report Layout
            • Specify Page Settings
          • Label Report
        • Data Source Wizard
          • Specify Data Source Settings (Database)
          • Specify Data Source Settings (JSON)
          • Specify Data Source Settings (Object)
        • Design Surface
        • Main Menu
        • Main Toolbar
        • Toolbox
        • Query Builder
        • Chart Designer
        • Expression Editor
        • Filter Editor
        • Format String Editor
        • Master-Detail Relation Editor
        • Script Editor
        • Localization Editor
        • UI Panels
          • Properties Panel
          • Expressions Panel
          • Field List
          • Report Explorer
    • Metric Report Manager
      • First look at the report manager
      • End user management
      • Open a report using the Report Manager
      • Add new report to the Report Manager

    Manage users

    Report Manager users

    In this documentation we will show a user management when for authentication and authorization is provided by ASP.NET Core Blazor authentication and authorization.

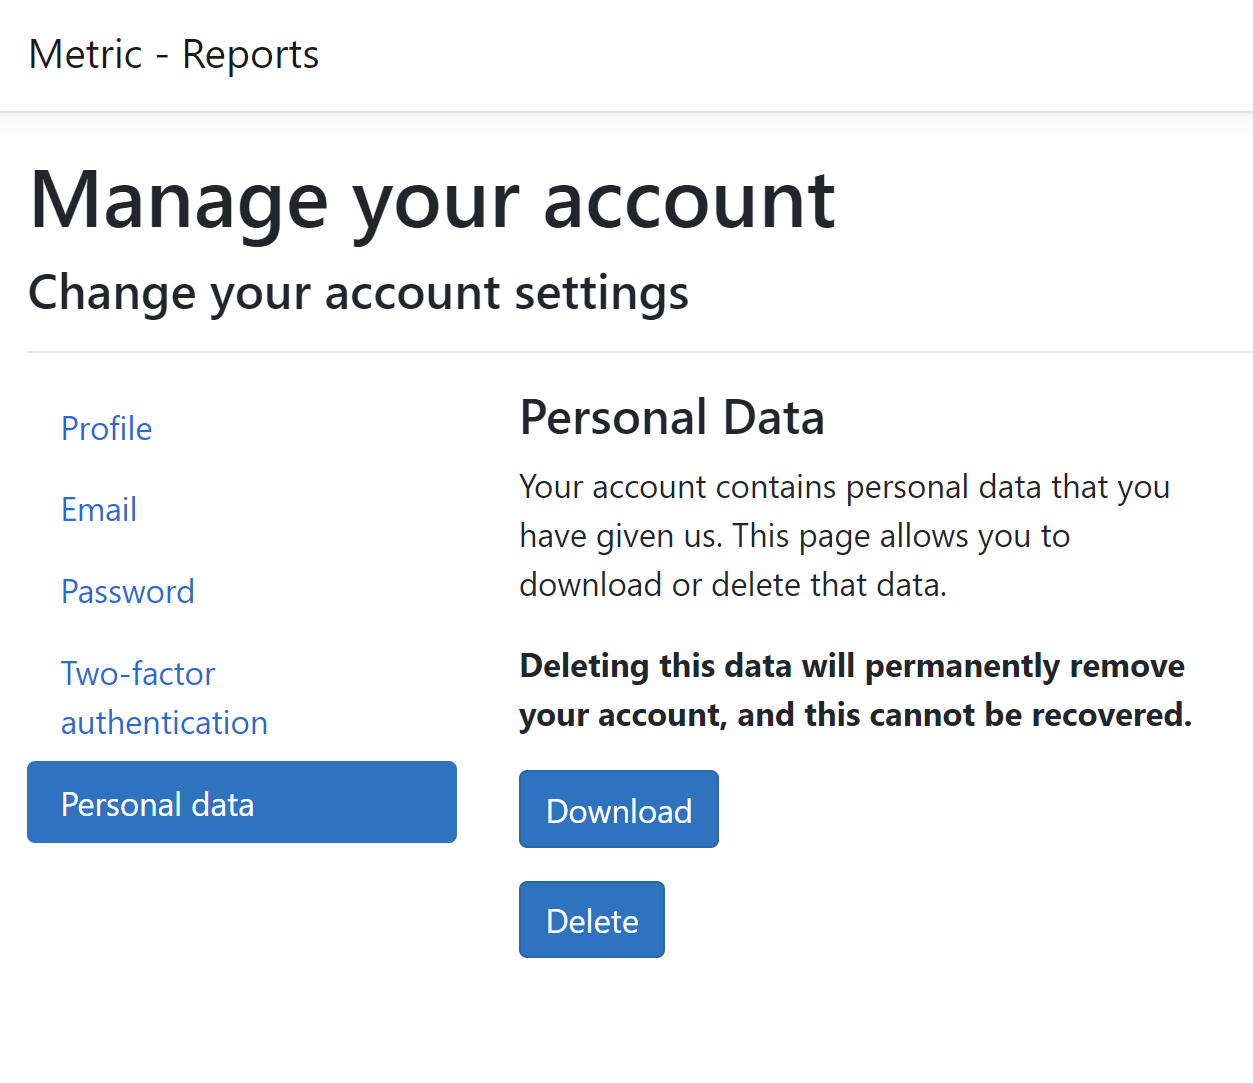
    • The new user himself, via the web, enters his username and password. The password is encrypted in the database and no one can find out.
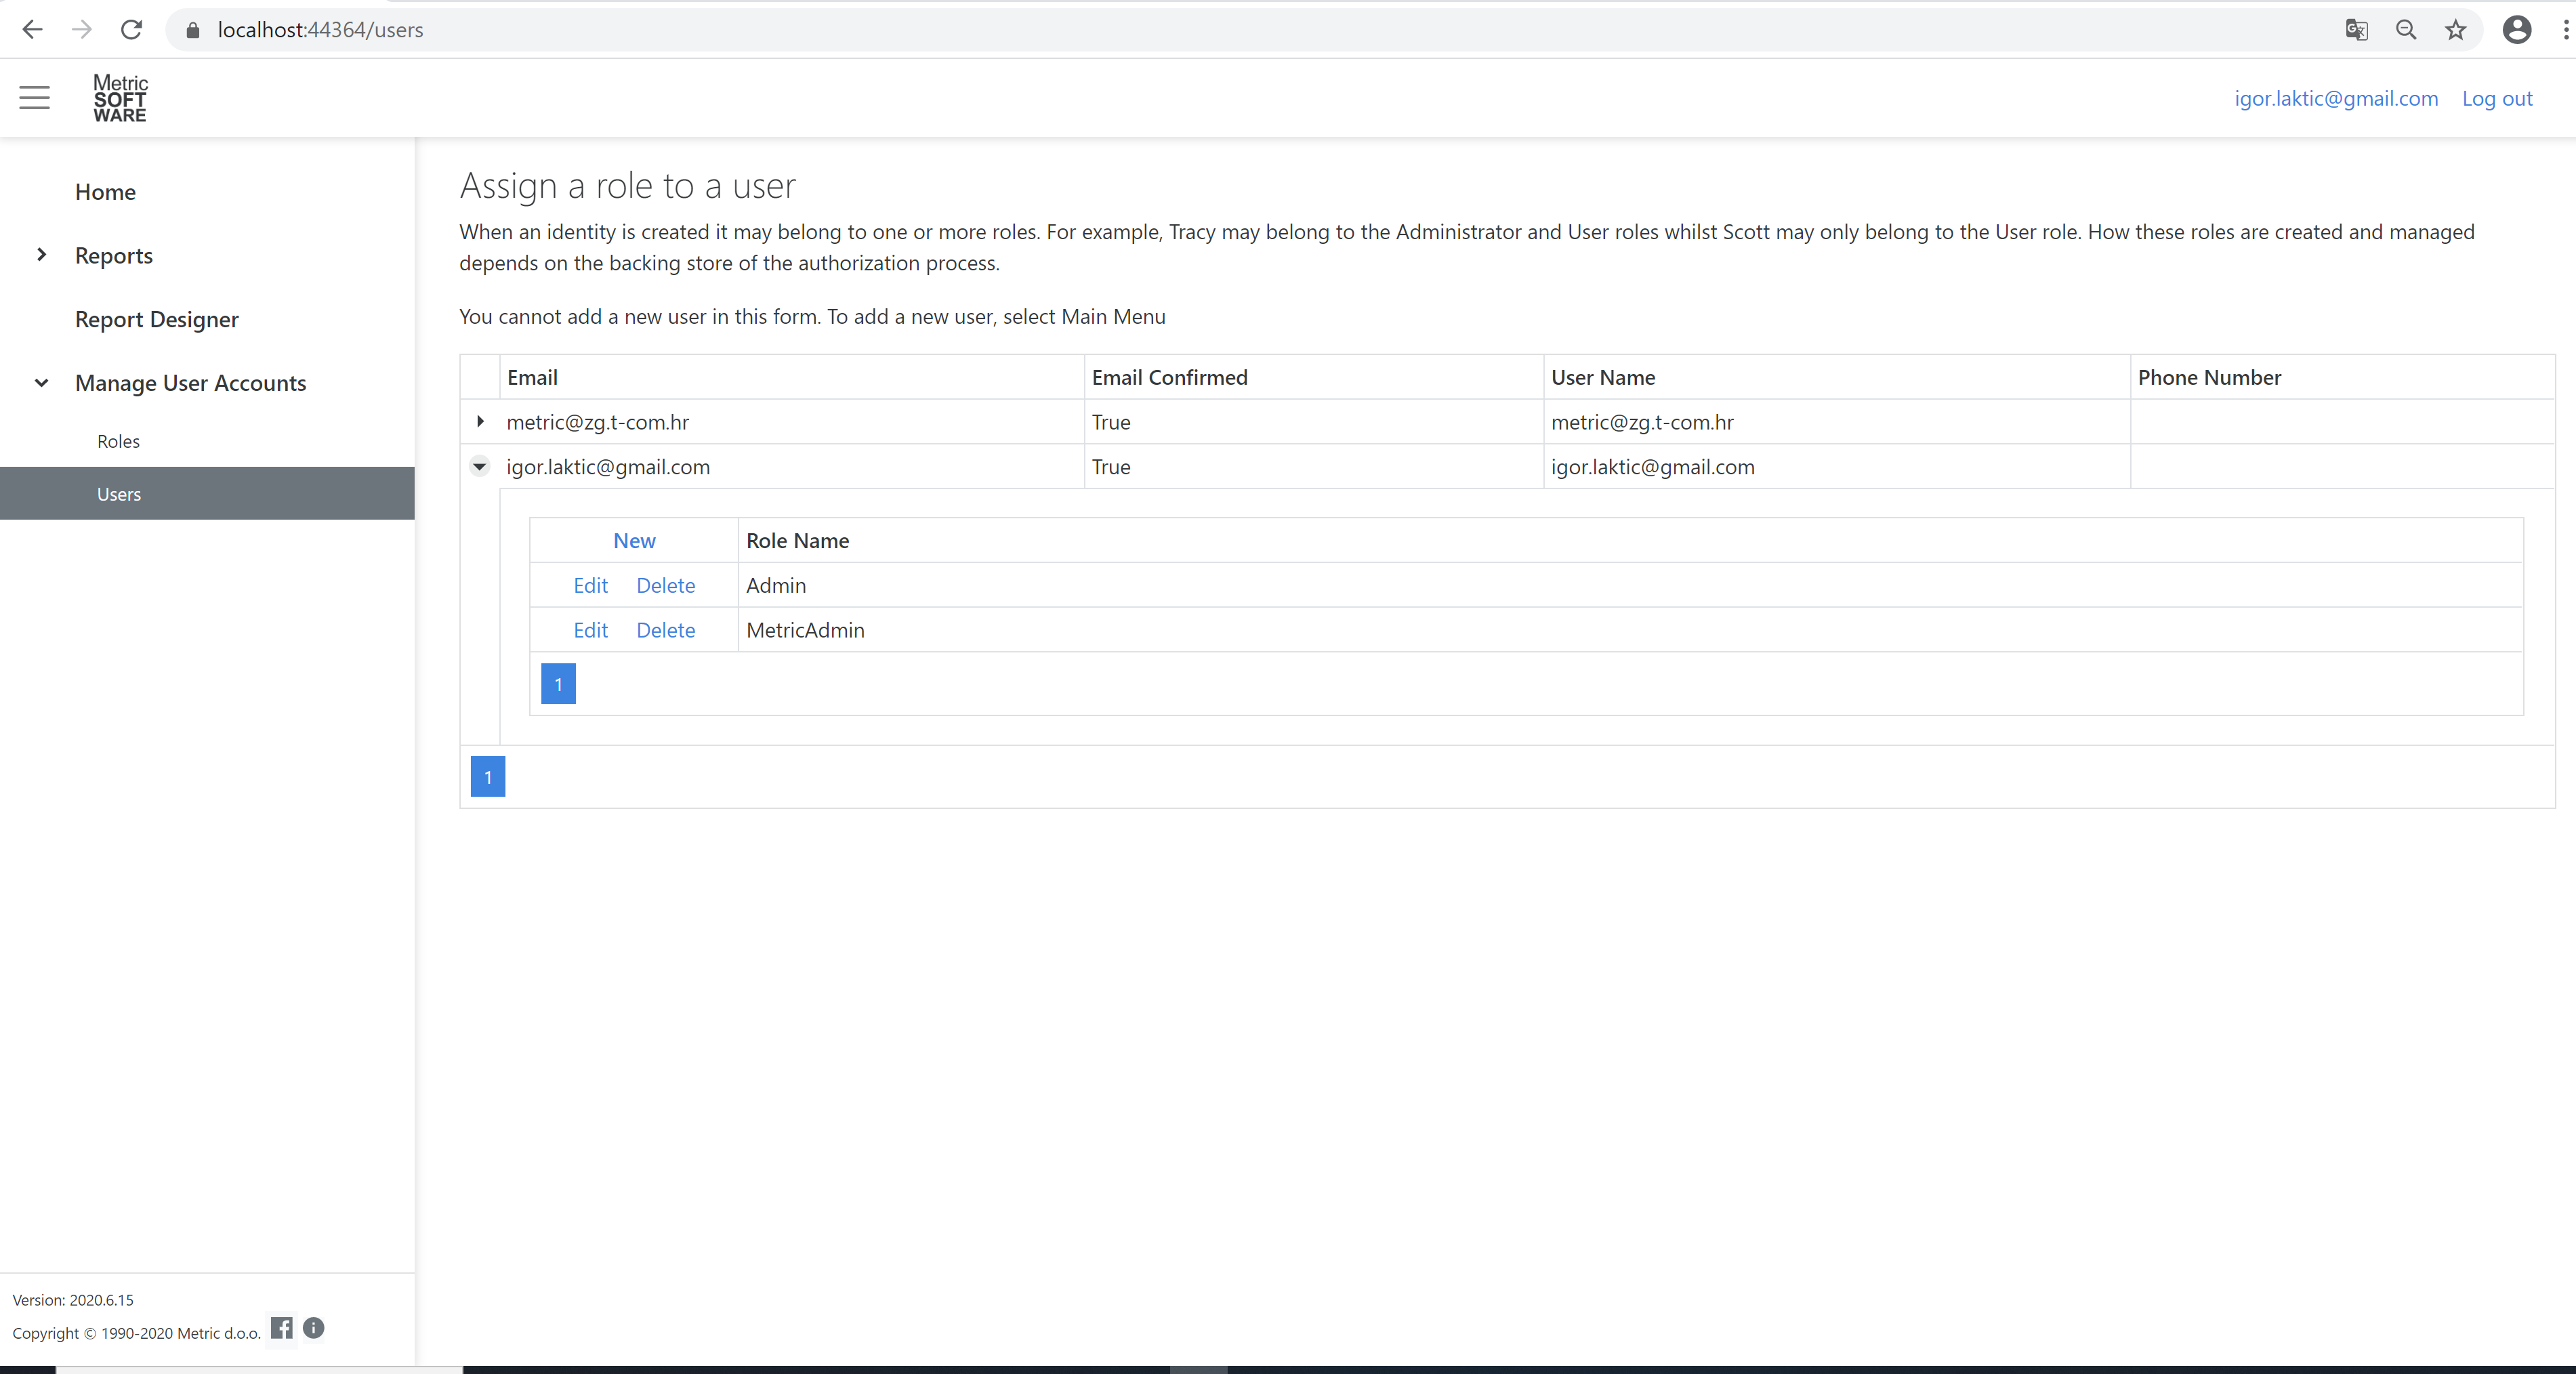
    • The administrator gives the user the right to access certain functions of the application.
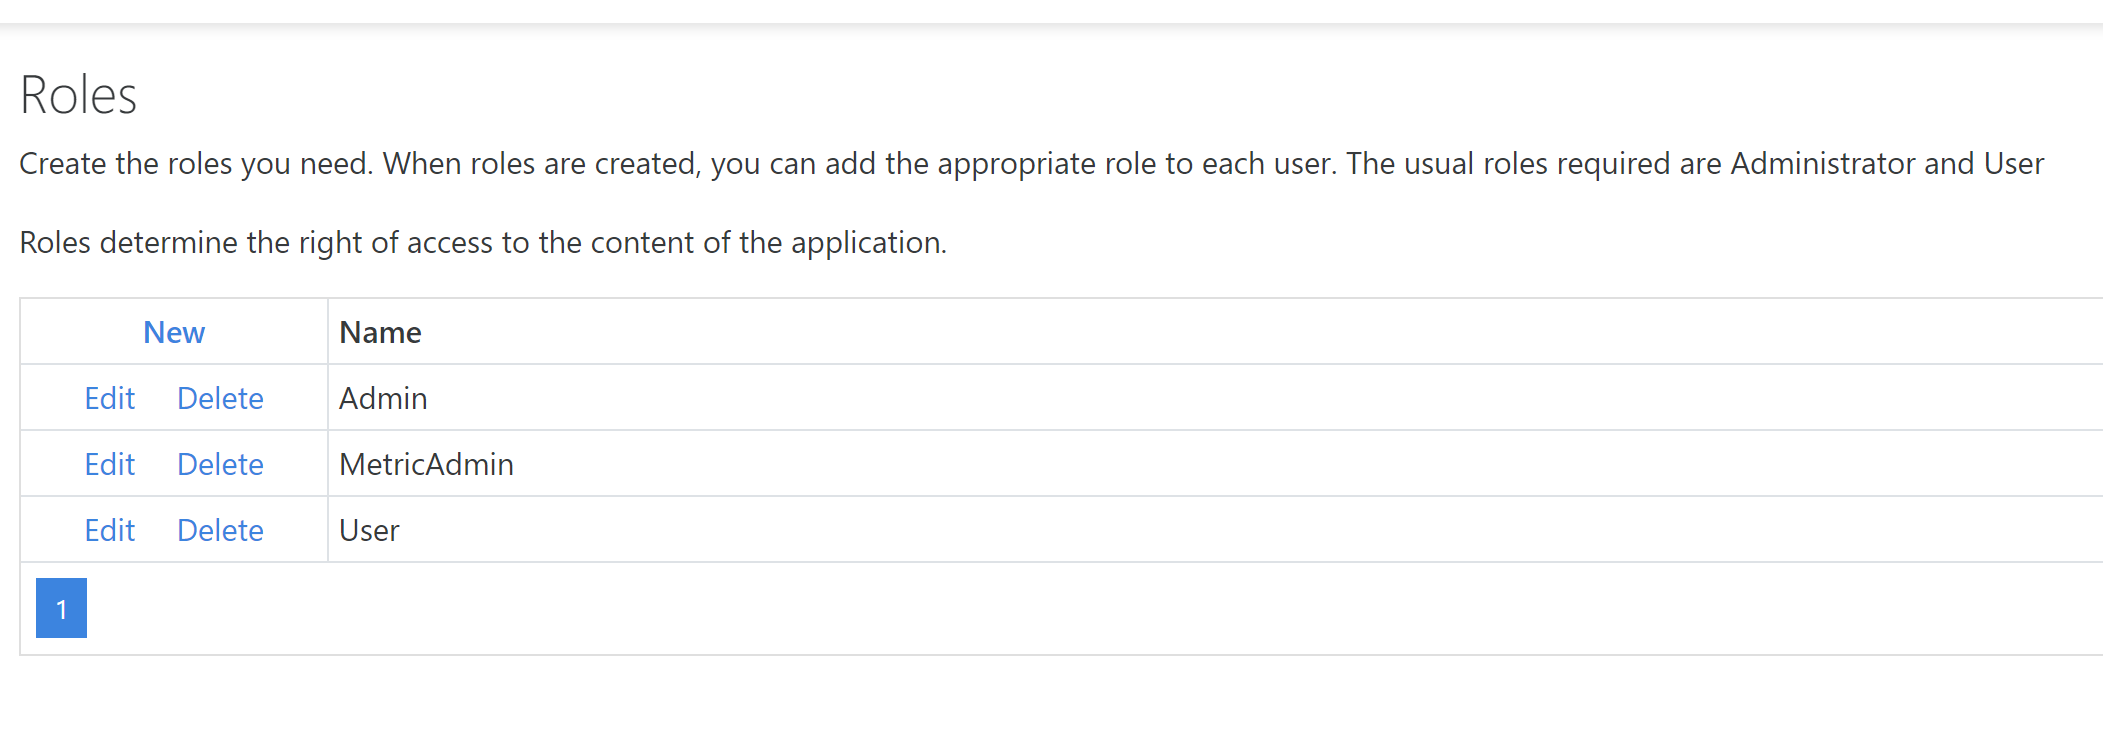
    • User rights are grouped through roles. The user can have multiple rolls.
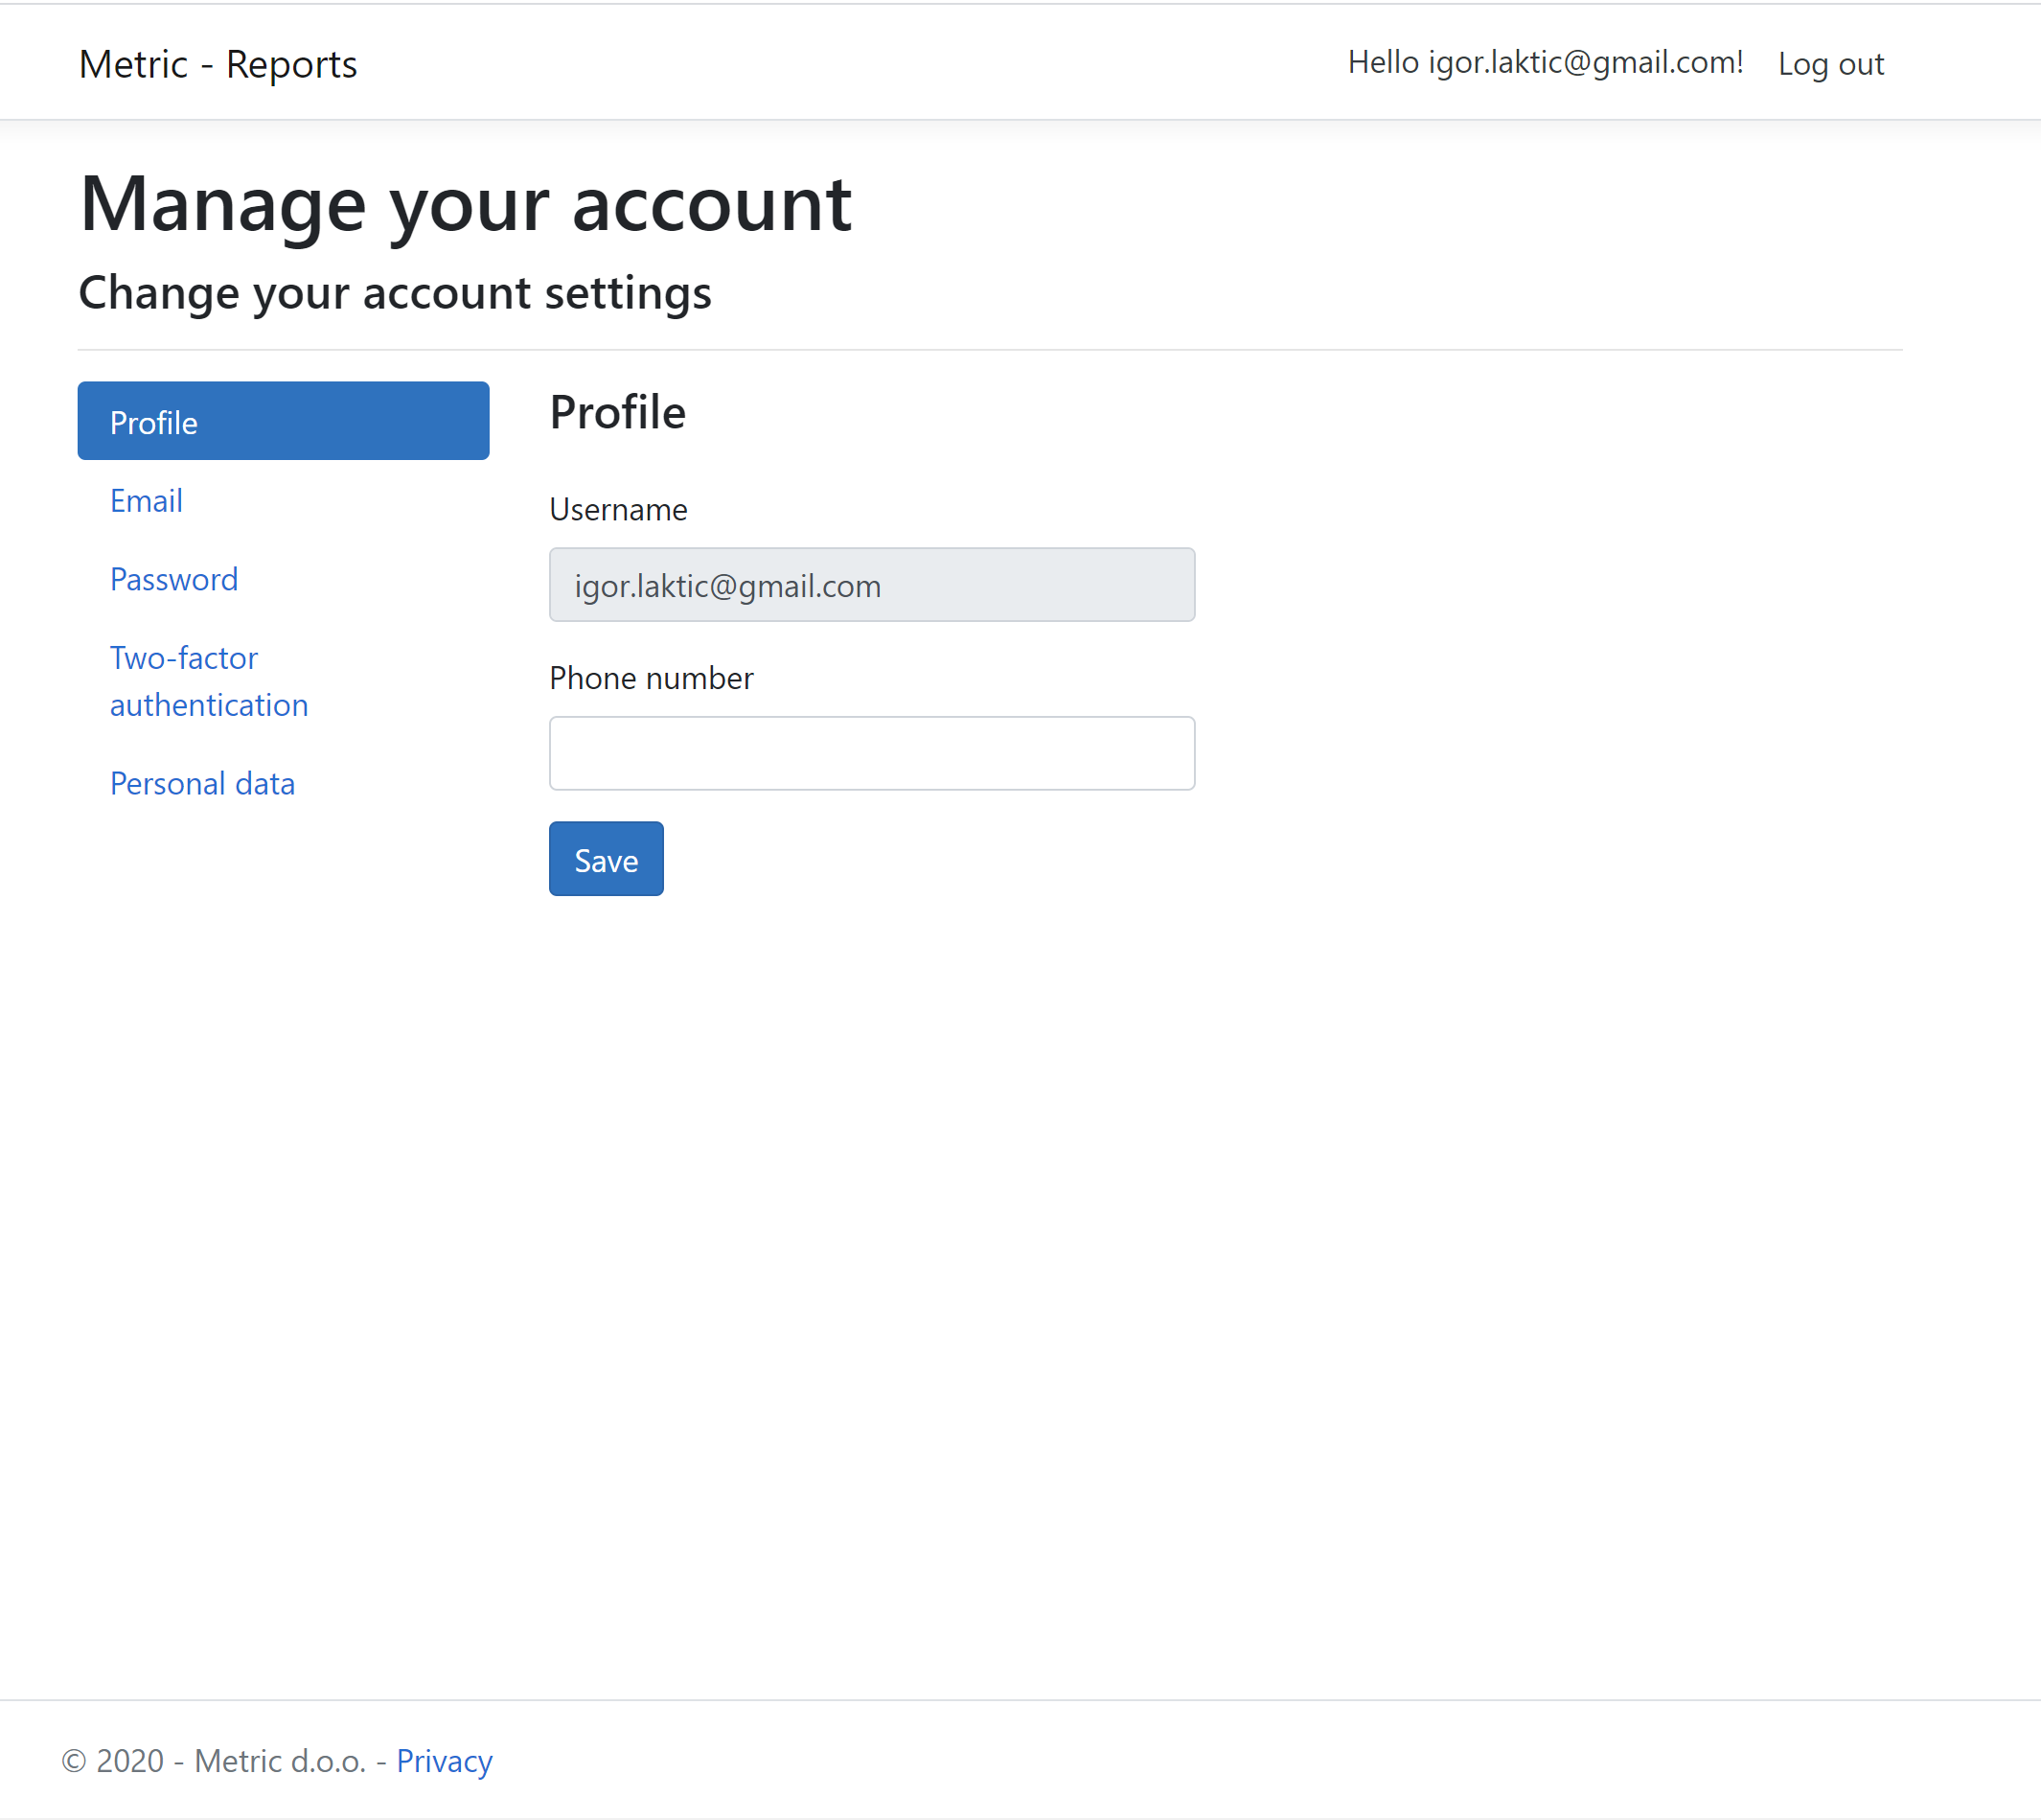
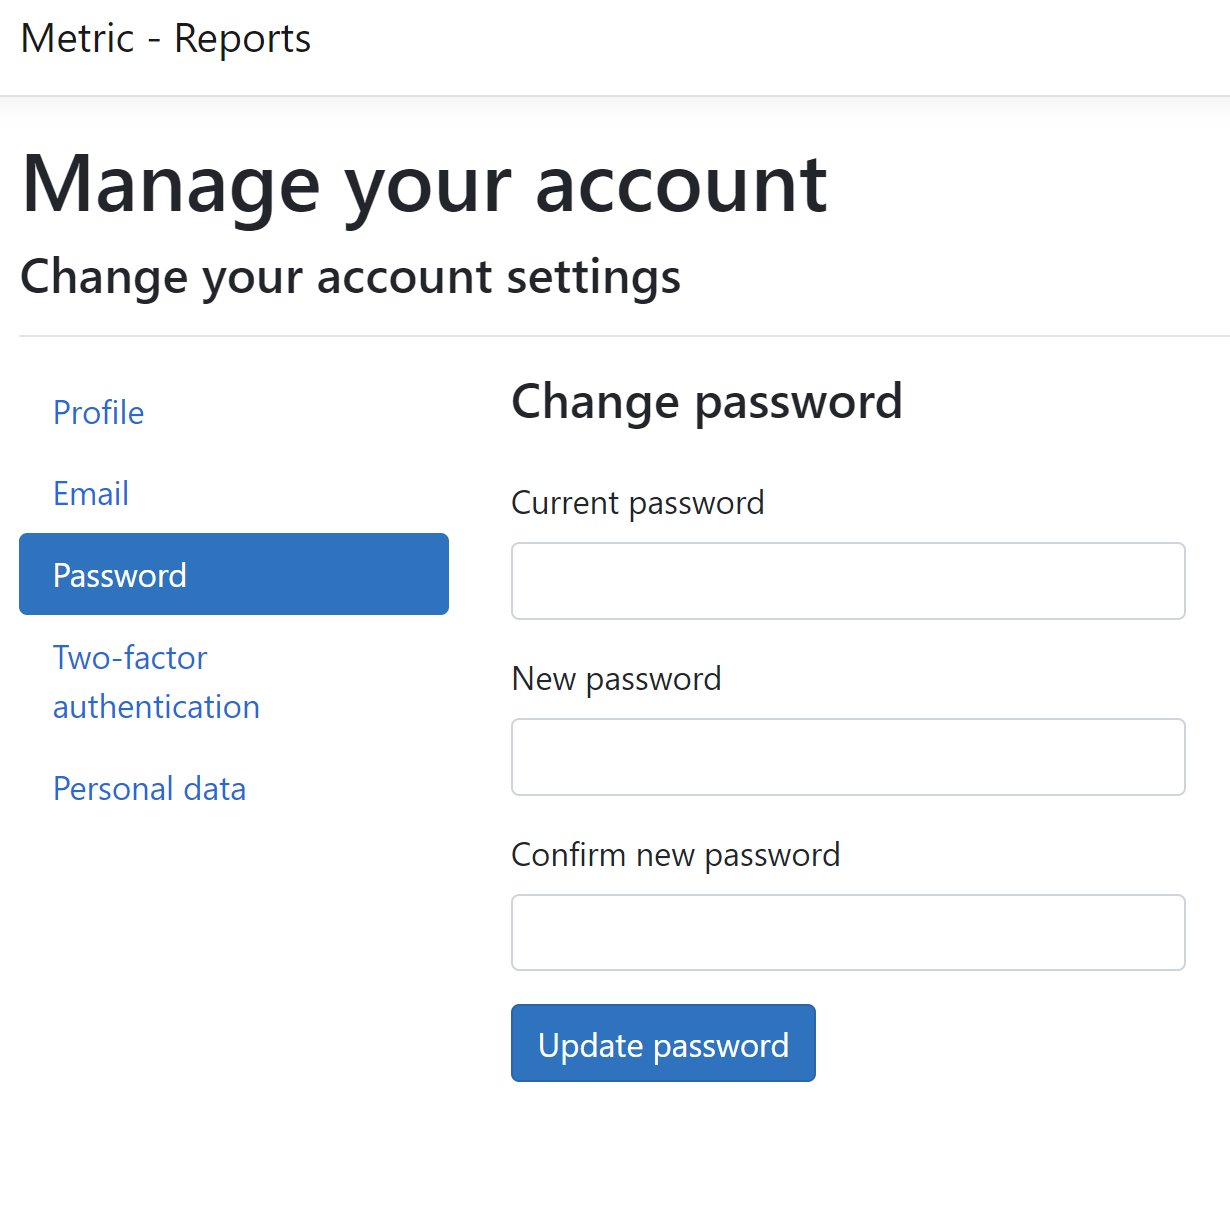
    • The user can change the password himself. The length and characters that create the Password are controlled to meet system security
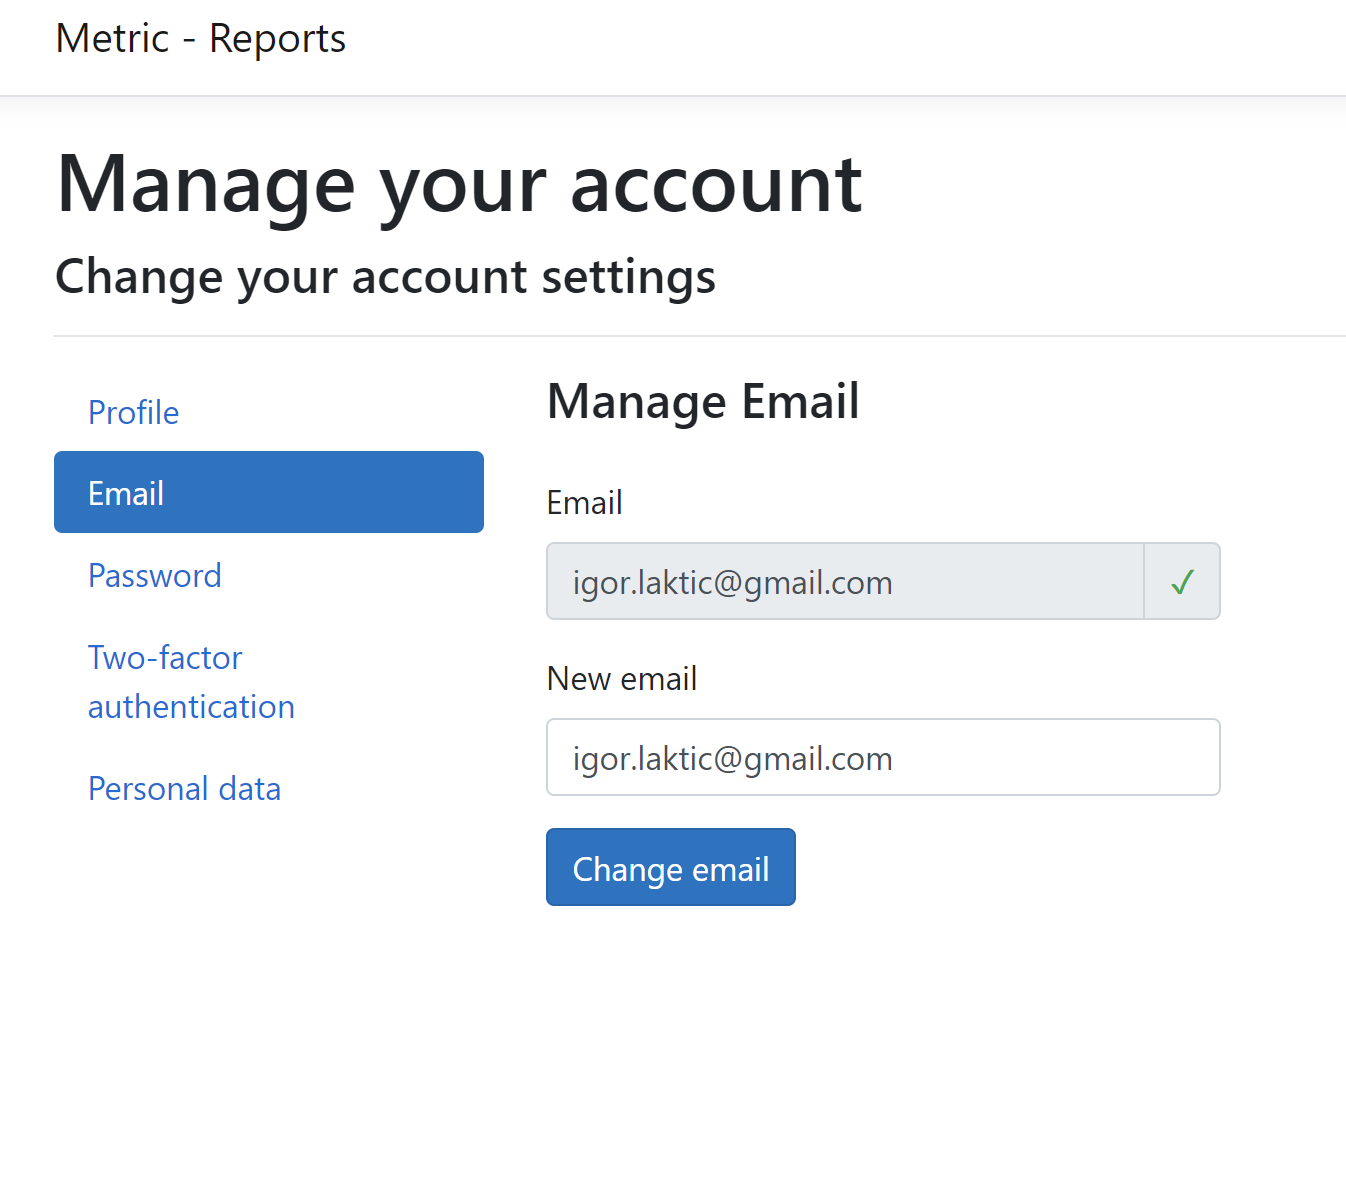
    • Username must be a user's email. In order to confirm the authenticity of the user, an e-mail is sent back to him, which the user confirms.

    The following are common forms of logging in and managing user rights.

    Report Manager Your Account

    Report Manager Change e-mail

    Report Manager Change password

    Report Manager Two Way Auth

    Report Manager Personal data

    Report Manager role

    Back to top Copyright © 2020 Metric d.o.o. www.mymetric.net, metric@zg.t-com.hr