• Metric Reports for Web
  • Dashboard for Web

    Show / Hide Table of Contents
    • Report Designer
      • First Look at the Report Designer
      • Add New Reports
      • Open Reports
      • Save Reports
      • Introduction to Banded Reports
      • Bind to Data
        • Bind a Report to a Database
        • Specify Query Parameters
        • Bind a Report to JSON Data
        • Bind a Report to an Object Data Source
        • Data Binding Modes
        • Bind Report Controls to Data (Expression Bindings)
        • Bind Report Controls to Data (Data Bindings)
        • Use Embedded Fields (Mail Merge)
        • Validate Report Data Bindings
      • Create Popular Reports
        • Create a Letter
        • Create a Table Report
        • Create an Invoice Manually
        • Create a Master-Detail Report (Use Detail Report Bands)
        • Create a Master-Detail Report (Use Subreports)
        • Create a Report with PDF Content
        • Create a Hierarchical Report
        • Create a Vertical Report
        • Create Labels and Badges
        • Create a Multi-Column Report
        • Create a Report with Cross-Band Content and Populated Empty Space
        • Create an Interactive E-Form
        • Create a Cross-Tab Report
      • Configure Design Settings
        • Change a Report's Measurement Units
        • Change a Report's Page Settings
        • Enable the Right-To-Left Layout
      • Use Report Elements
        • Manipulate Report Elements
          • Add Controls to a Report
          • Select Report Elements and Access Their Settings
          • Move and Resize Report Elements
          • Apply Styles to Report Elements
          • Copy Report Controls
          • Arrange Report Controls
          • Add Report Controls to Containers
          • Validate the Report Layout
        • Use Basic Report Controls
          • Label
          • Character Comb
          • Rich Text
          • Check Box
          • Picture Box
          • Subreport
          • Panel
          • Page Break
          • Table of Contents
          • Page Info
        • Use Tables
          • Table Overview
          • Bind Table Cells to Data
          • Manage Table Structure
          • Manipulate Table Elements
          • Hide Table Cells
        • Use Bar Codes
          • Add Bar Codes to a Report
          • Bar Code Recognition Specifics
          • Codabar
          • Code 11 (USD-8)
          • Code 128
          • Code 39 (USD-3)
          • Code 39 Extended
          • Code 93
          • Code 93 Extended
          • EAN 13
          • EAN 8
          • ECC200 - Data Matrix
          • GS1 - DataBar
          • GS1- Data Matrix
          • GS1-128 - EAN-128 (UCC)
          • Industrial 2 of 5
          • Intelligent Mail
          • Intelligent Mail Package
          • Interleaved 2 of 5
          • Matrix 2 of 5
          • MSI - Plessey
          • PDF417
          • PostNet
          • QR Code
          • UPC Shipping Container Symbol (ITF-14)
          • UPC Supplemental 2
          • UPC Supplemental 5
          • UPC-A
          • UPC-E0
          • UPC-E1
        • Use Charts and Pivot Grids
          • Use Charts in Reports
          • Add a Chart (Set Up Series Manually)
          • Add a Chart (Use a Series Template)
          • Use Charts to Visualize Grouped Data
          • Link a Chart and a Pivot Grid
        • Use Gauges and Sparklines
          • Add Gauges to a Report
          • Add Sparklines to a Report
        • Draw Lines and Shapes
          • Draw Lines
          • Draw Shapes
          • Draw Cross-Band Lines and Boxes
      • Shape Report Data
        • Filter Data
          • Filter Data at the Report Level
          • Filter Data at the Data Source Level
          • Limit the Number of Records to Display
        • Group and Sort Data
          • Sort Data
          • Group Data
          • Sort Data by a Custom Field
          • Group Data by a Custom Field
          • Sort Groups by a Summary Function's Result
        • Shape Data (Expression Bindings)
          • Format Data
          • Conditionally Change a Control's Appearance
          • Conditionally Change a Label's Text
          • Conditionally Change a Band's Visibility
          • Conditionally Filter Report Data
          • Conditionally Suppress Controls
          • Limit the Number of Records per Page
          • Calculate a Summary
          • Calculate an Advanced Summary
          • Display Row Numbers in a Report, Group or Page
          • Count the Number of Records in a Report or Group
          • Count the Number of Groups in a Report
        • Shape Data (Data Bindings)
          • Format Data
          • Conditionally Change a Control's Appearance
          • Conditionally Change a Label's Text
          • Conditionally Change a Band's Visibility
          • Conditionally Filter Report Data
          • Conditionally Suppress Controls
          • Limit the Number of Records per Page
          • Calculate a Summary
          • Calculate a Custom Summary
          • Display Row Numbers in a Report, Group or Page
          • Count the Number of Records in a Report or Group
          • Count the Number of Groups in a Report
        • Use Calculated Fields
          • Calculated Fields Overview
          • Calculate an Aggregate Function
          • Calculate a Weighted Average Function
        • Use Report Parameters
          • Create a Report Parameter
          • Report Parameters with Predefined Static Values
          • Report Parameters with Predefined Dynamic Values
          • Multi-Value Report Parameters
          • Cascading Report Parameters
          • Date Range Report Parameters
      • Lay out Dynamic Report Content
        • Maintain the Band Location on a Page
        • Keep Content Together
        • Maintain the Size and Content of Data-Bound Controls
        • Anchor Controls
        • Suppress Controls
      • Customize Appearance
        • Appearance Properties
        • Report Visual Styles
      • Add Navigation
        • Add Page Numbers
        • Add Cross-References and Hyperlinks
        • Add Bookmarks and a Document Map
        • Create a Table of Contents
      • Provide Interactivity
        • Create Drill-Down Reports
        • Sort a Report in Print Preview
        • Edit Content in Print Preview
      • Add Extra Information
        • Add Watermarks to a Report
        • Display the Current Date and Time in a Report
        • Display the User Name in a Report
      • Merge Reports
        • Add a Report to the End/Beginning
        • Use Data-Driven Page Sequence
      • Use Expressions
        • Expression Syntax
      • Localize Reports
      • Preview, Print and Export Reports
      • Report Designer Tools
        • Report Wizard
          • Empty Report
          • Table and Vertical Report
            • Select Data Source
            • Specify Data Source Settings (Database)
            • Specify Data Source Settings (JSON)
            • Specify Data Source Settings (Object)
            • Define Report Layout
            • Specify Page Settings
          • Label Report
        • Data Source Wizard
          • Specify Data Source Settings (Database)
          • Specify Data Source Settings (JSON)
          • Specify Data Source Settings (Object)
        • Design Surface
        • Main Menu
        • Main Toolbar
        • Toolbox
        • Query Builder
        • Chart Designer
        • Expression Editor
        • Filter Editor
        • Format String Editor
        • Master-Detail Relation Editor
        • Script Editor
        • Localization Editor
        • UI Panels
          • Properties Panel
          • Expressions Panel
          • Field List
          • Report Explorer
    • Metric Report Manager
      • First look at the report manager
      • End user management
      • Open a report using the Report Manager
      • Add new report to the Report Manager

    Label

    Label Overview

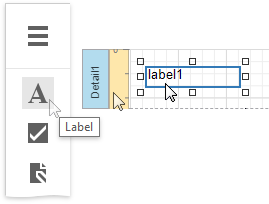
    The Label control displays plain text in a report. Drag the Label item from the Toolbox onto the report's area to add a Label control to it.

    Double-click the label to invoke its in-place editor and enter the desired static text.

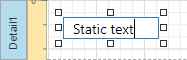
    Press CTRL+Enter to submit text changes and exit the label's in-place editing mode.

    Bind to Data

    Display Field Values

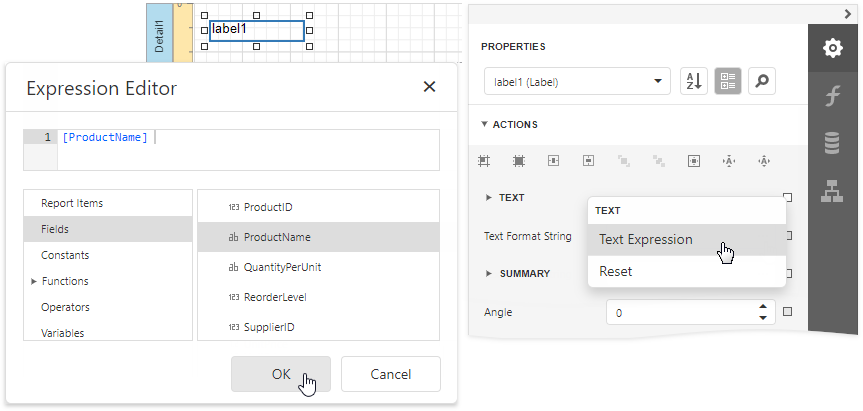
    You can bind the label's Text property to a data field obtained from a report's data source. Switch to the Properties panel, expand the Actions category and click the Text property's marker. Select Text Expression from the popup menu. Then select a data field or construct a binding expression in the invoked Expression Editor.

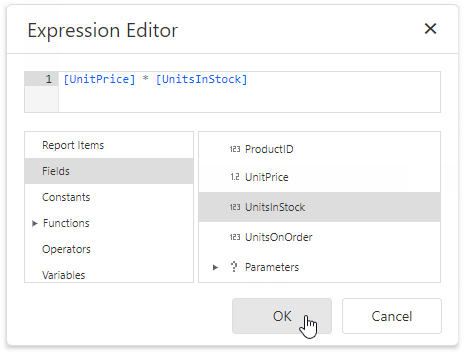
    You can use the Expression Editor to construct a complex binding expression that involves two or more data fields.

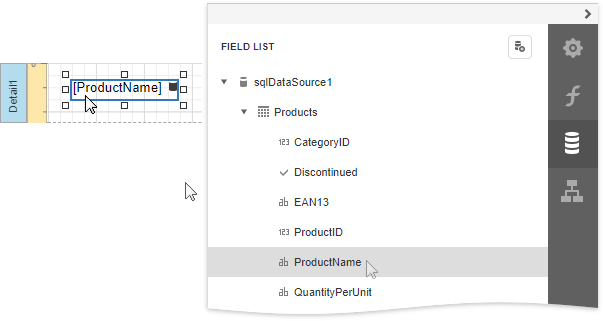
    You can also drag and drop a numeric or text field from the Field List to create a new label bound to this field.

    See the Bind Controls to Data topic for more information.

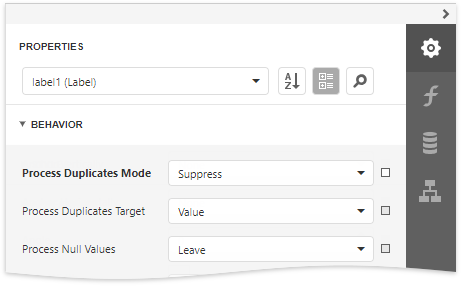
    The Process Duplicates Mode, Process Duplicates Target and Process Null Values options enable you to hide a control when a duplicated or null value appears in an assigned data source.

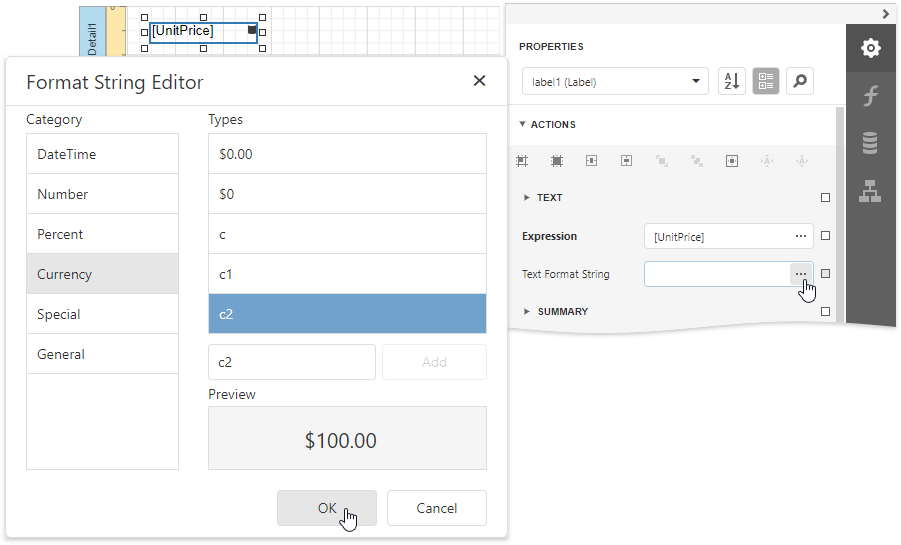
    You can also use the Text Format String property to specify output values' format.

    Display Summaries

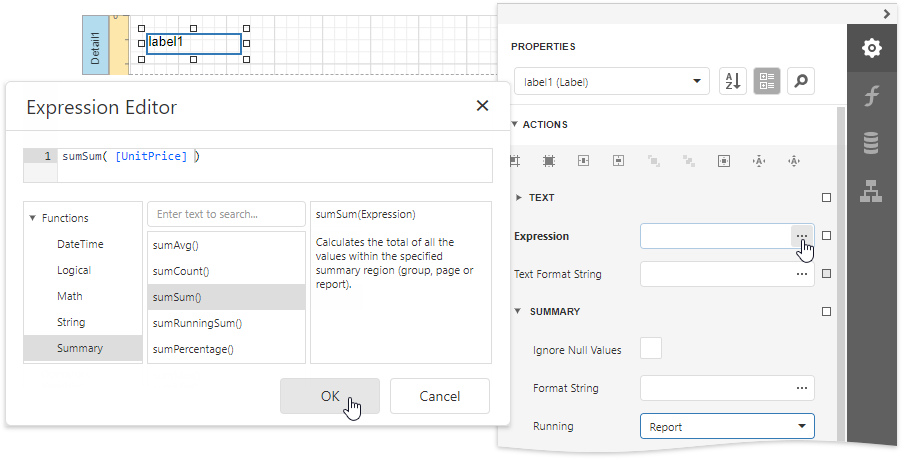
    Specify a data range in the Running property and select the summary function in the Expression Editor to display a summary function's result in a label.

    Adjust the Label Size and Content

    Static Content

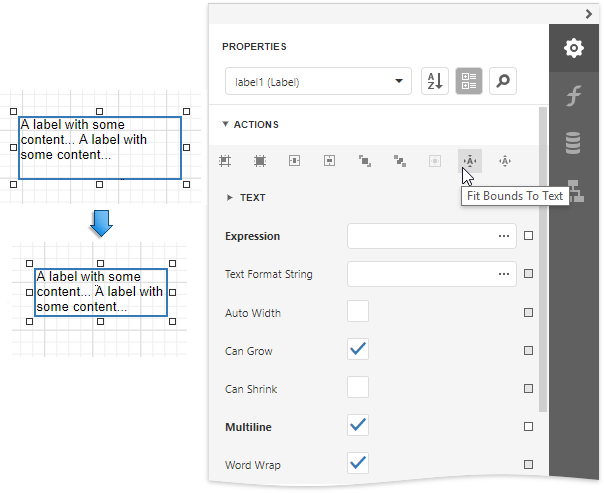
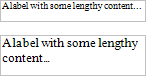
    You can change a label's size to fit its static text using the Fit Bounds To Text command in the Actions category:

    • If the Word Wrap option is enabled, the command displays control content in multiple lines. It reduces control height and adjusts its width to fit its content.

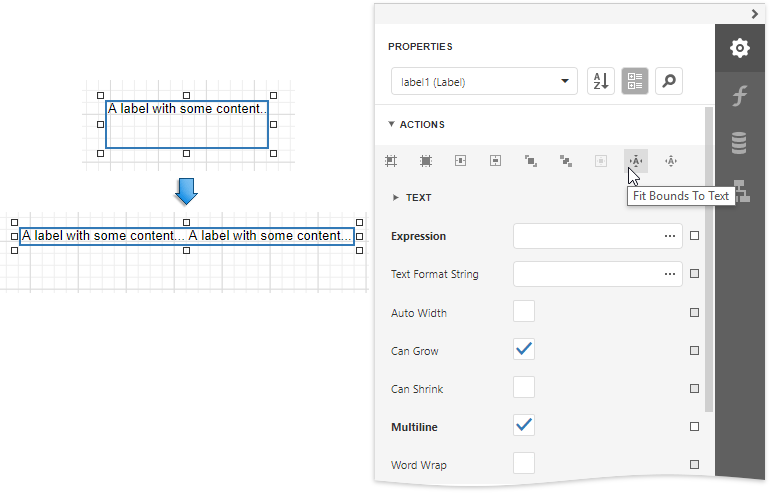
    • If the Word Wrap option is disabled and the control's content is partially visible, the command adjusts the control's size to display this content.

    This command's result also depends on the control's Text Alignment and Right To Left settings.

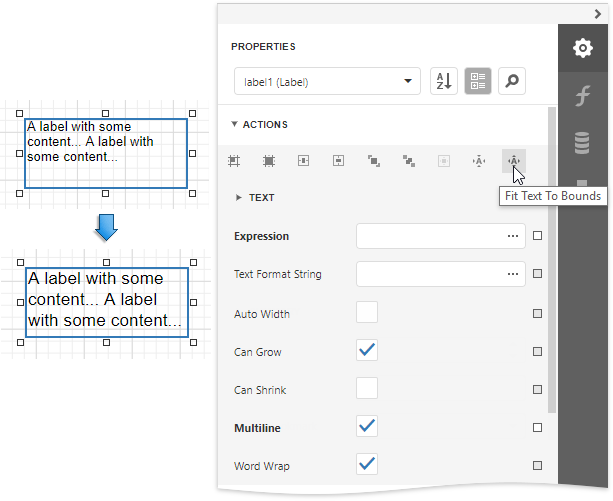
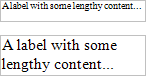
    Use the Fit Text To Bounds button to adjust the control's font size to fit its area. The Word Wrap option defines whether the text can occupy multiple lines or should be in a single line.

    These commands are not available in the following cases:

    • A label's text is an empty string;
    • A label's text is bound to data;
    • A label's Angle property is specified.

    Data-Bound Labels

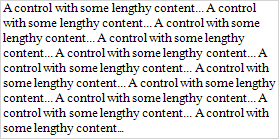
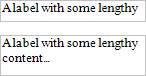
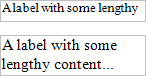
    The Can Grow and Can Shrink properties allow you to increase or decrease the control's height according to its content in Print Preview mode.

    Can Grow is enabled Can Grow is disabled
    Can Shrink is enabled CanShrink is disabled

    The Auto Width property specifies whether to adjust a data-bound label's width to its content automatically.

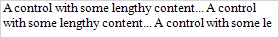
    You can also use the opposite Text Fit Mode property to adjust a control's font size to fit its boundaries in Print Preview. This property is not available if the Can Grow, Can Shrink or Auto Width option is enabled.
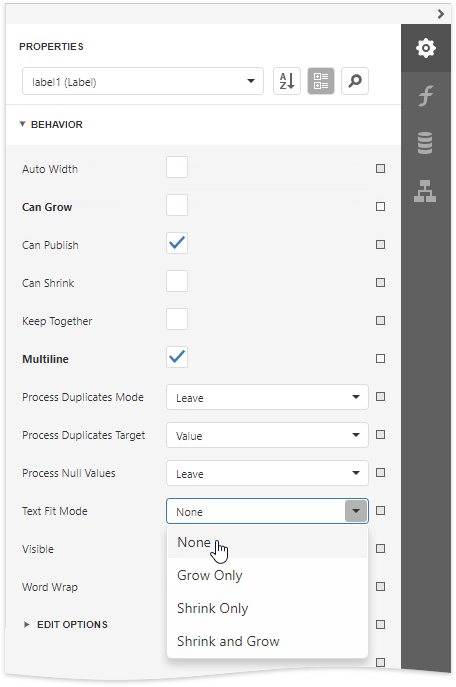
    Text Fit Mode = None Text Fit Mode = Grow Only Text Fit Mode = Shrink Only Text Fit Mode = Shrink And Grow

    See the Lay out Dynamic Report Content topic for more information.

    Interactivity

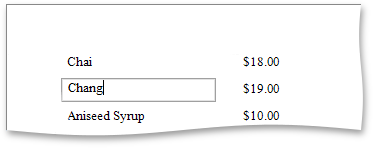
    Set the Enabled option in the Edit Options category section to Yes to edit a label's content in Print Preview mode.

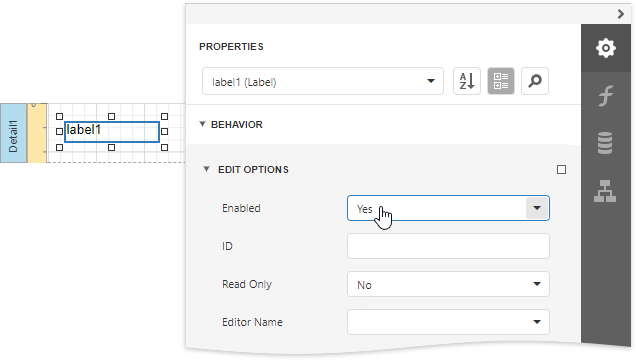
    Clicking this label in a previewed document invokes the appropriate editor.

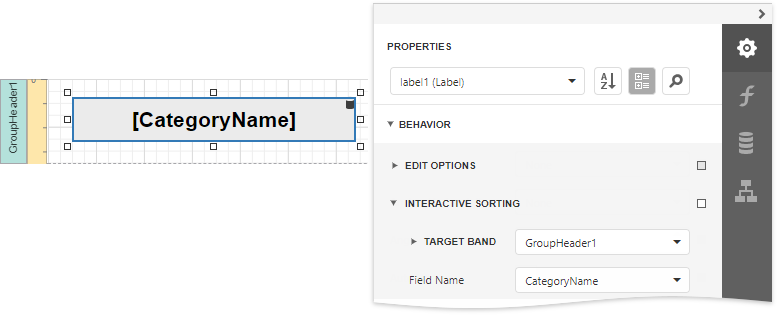
    Use the label's Interactive Sorting option to click this label in Print Preview to sort report data. Set the Target Band property to the Group Header or Detail band, and specify the data field in the Field Name property.

    Refer to Sort a Report in Print Preview for a step-by-step tutorial.

    Markup Text

    Enable the Allow Markup Text property to format the label's text with markup tags.

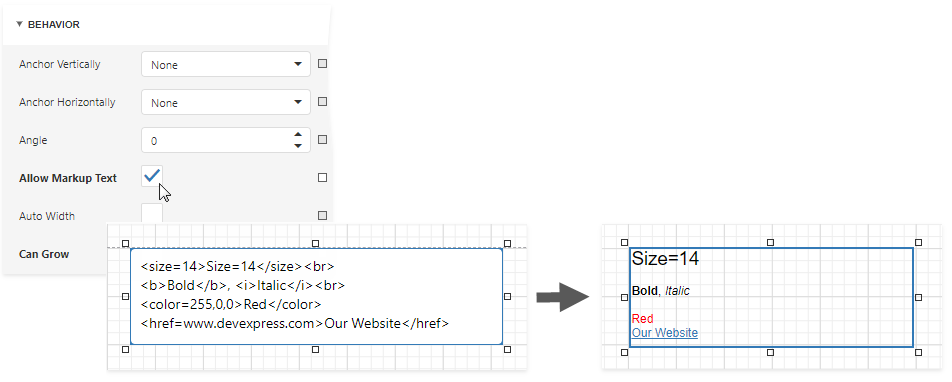
    Label supports the following tags:

    Tag End Tag Description
    <br> Inserts a single line break. Enable the WordWrap property to use this tag.
    <nbsp> - Inserts a space.
    <color=value> </color> Specifies the text color.
    <backcolor=value> </backcolor> Specifies the background color.
    <size=value> </size> Specifies the font size.
    <b> </b> Defines bold text.
    <i> </i> Defines italic text.
    <s> </s> Defines strikethrough text.
    <u> </u> Defines underlined text.
    <image=value> - Inserts an image from the report's named image collection. Supports both raster images and SVG images. Use the report's Image Resources property to provide images and reference them by their Id. The image tag's size attribute sets the image display pixel size. If the specified width/height exceeds the label's width/height, it is reduced to display the entire image. Specify the size attribute after the tag's value followed by the ";" character.
    <href=value> </href> Displays a hyperlink. The value string specifies the hyperlink source, and the string between the opening and closing tags is the text to display.

    When a report is exported to XLS or XLSX, the following rich-text content is converted from labels into Excel-native rich-text content:

    Text format <b>, <i>, <u>, <s>
    Line break <br>
    Non-breaking space <nbsp>
    Font <font=[font name]>
    Font size <size=[font size]>
    Foreground color <color=[color]>
    Back to top Copyright © 2020 Metric d.o.o. www.mymetric.net, metric@zg.t-com.hr